- Webinars
Are electricity network incentive schemes rewarding the wrong behaviour?
As the Australian Energy Regulator (AER) ponders the merits of its incentive-based regulatory approach, analysis from Energeia suggests that the existing incentive schemes are doomed to fail.
Unfortunately, the findings are clear. Spending on capital works such as grid upgrades increase shareholder returns by 200 percent compared to the best performing non-network incentive, according to our analysis.
This is a far better reward for network businesses than either lower cost, non-network solutions or higher net benefit, whole-of-systems solutions.
The theory behind Australia’s system of regulatory incentives is sound. Regulated businesses are rewarded for innovating and being as efficient as possible, and consumers win with lower network costs over time.
However, it’s not being put into practice. Spending on non-network alternatives such as consumer-owned DER resources is being largely ignored, along with billions of dollars of potential savings on all customer bills.
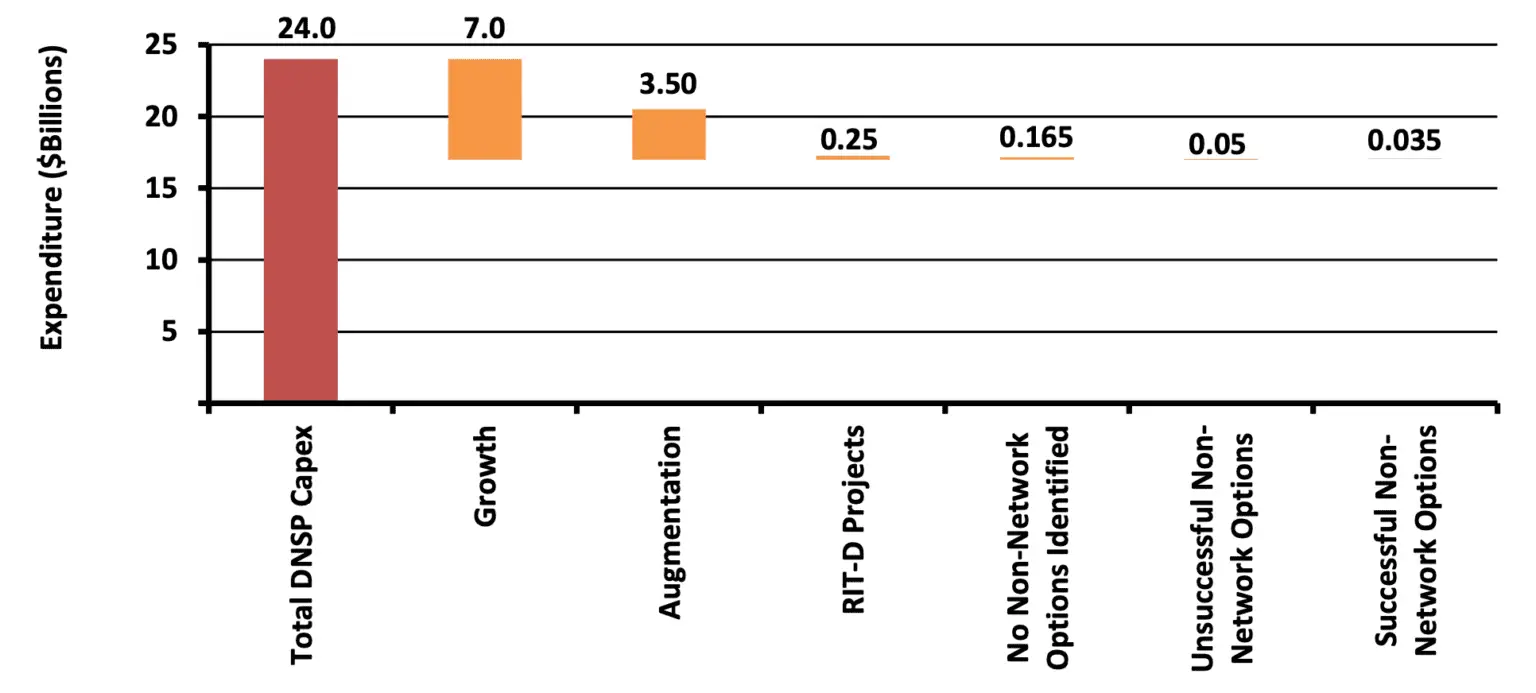
Analysis by the AER over the 2013-17 period shown in the figure below found that networks were spending just $35 million on non-network options out of their $24 billion capital investment programs – just 0.15 percent.

One of the key reasons for this is that the regulatory incentives in play just cannot compete with the multiplier effect on the valuation of a network business that’s earned from building the regulated asset base (RAB).
While it is easy to point the finger at networks for pumped-up network investment, a closer look suggests it may just be an economically rational outcome of an incentive system that is in desperate need of reform.
Unpacking our incentive schemes
There are five incentive schemes in our regulatory system that aim to encourage efficiency while maintaining service levels. These incentives combine with other regulations to simulate competitive pressures and to encourage innovation by monopoly energy network service providers.
The two largest in terms of risk and reward are the Efficiency Benefit Sharing Scheme (EBSS) and Capital Efficiency Sharing Scheme (CESS). They both allow networks to keep 30 percent of avoided efficient operational and capital expenditure for five years.
The other significant program is the Demand Management Innovation Allowance Mechanism (DMIAM) which allows networks to keep half of all operational costs that are an efficient alternative to network investment. It’s capped at one percent of total revenues.
The remaining two incentives schemes are relatively minor in terms of capital and operational efficiency but exist to encourage better customer service levels.
To judge whether the three major schemes have succeeded, Energeia looked back at the data from the last regulatory period.
We also used our customer end-to-end modelling to understand the potential opportunity for non-network solutions.
Lastly, we analysed the shareholder benefits of capital investment compared to not making a capital investment under a combination of payments under these incentive schemes.
Unpacking our incentive schemes
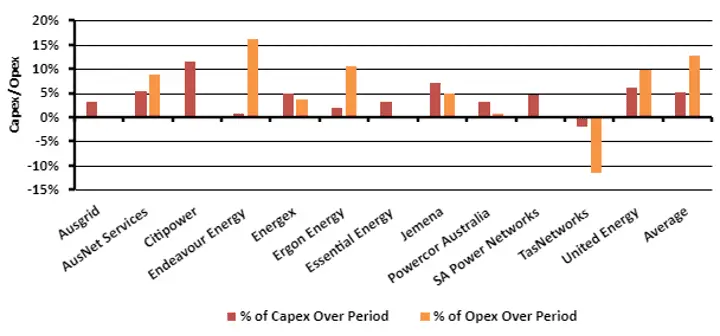
Our analysis of the last regulatory period shows that on average electricity networks only earned 5 percent of their capital expenditure revenue from the CESS. The EBSS performed a little better making up 13 percent of average opex revenues for the period.

We also discovered that total spending on non-network alternatives such as Distributed Energy Resources (DER) amounted to just 0.1 percent of total network spending.
This is a disturbingly small amount, when you consider one of our earlier conclusions that up to 25 percent of all network spending could potentially be replaced with non-network investments, reducing network costs by up to $27 billion over the next 25 to 30 years.
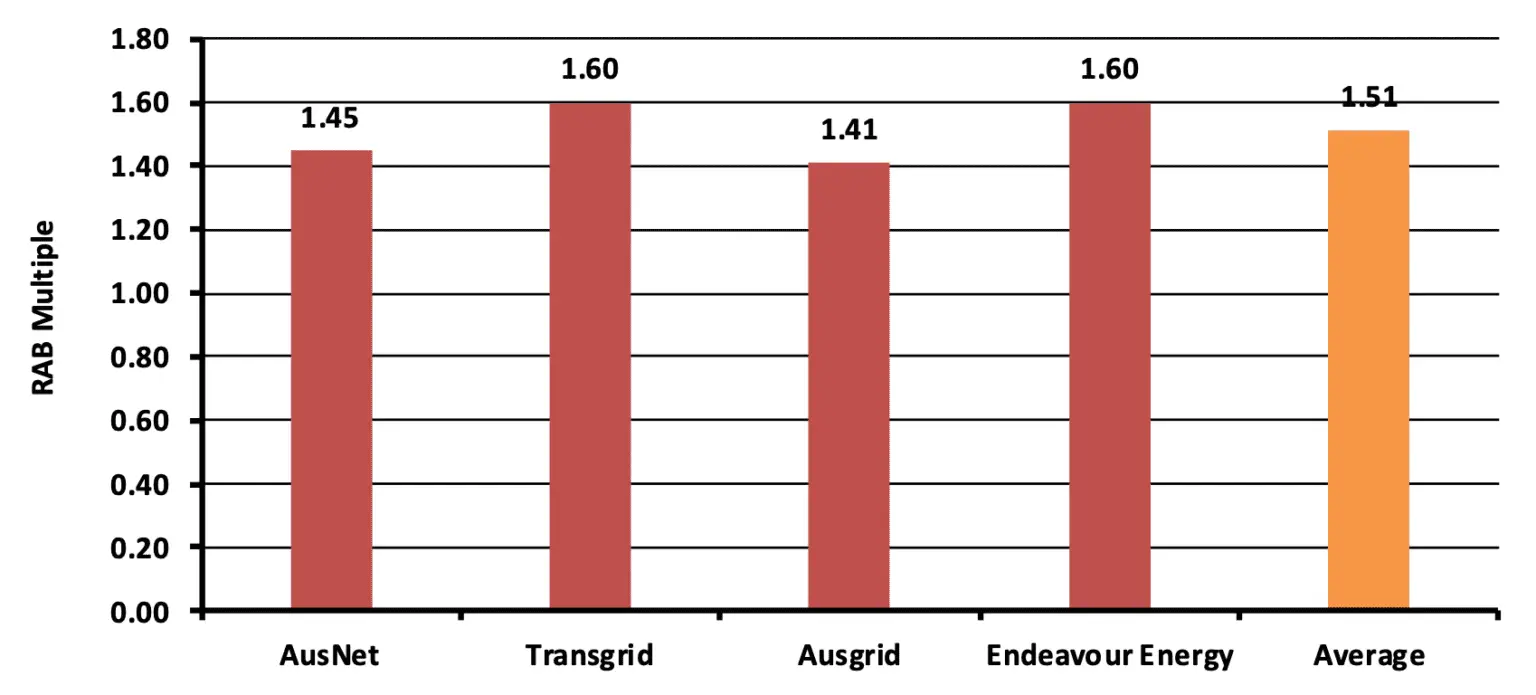
This all makes sense when you understand that networks can earn a far greater total return for their shareholders from network investment – at least 200 percent better – compared to returns earned from regulatory incentives.

This estimate is based on the reported RAB asset base multipliers paid by investors for network businesses since 2004.
In these circumstances, an economically rational investor, who elects the Board of Directors, and who in turn govern management performance, would always seek to maximise their total returns by favouring capital investment over the incentive schemes.
Above all else, this analysis underpins the dire need for the AER’s current review into Australia’s electricity network incentive schemes.
Read our full DER Optimisation Report commissioned by Renew here.
You may also like

Natural Gas Decarbonisation Strategies and Impacts
Energeia’s research outlines key pathways, including renewable gas blending, thermal energy networks, and end-use electrification, all vital for achieving carbon targets while minimizing economic disruption.

The Balance of Ancillary Services Pricing
FCAS exist to provide AEMO with operational reserves in case of unplanned variations in demand and supply to keep demand and supply of electricity in

Energeia Assists AEMC on Potential Rule Change
The Australian Energy Market Commission (AEMC) has proposed draft rules aimed at transforming how power companies and consumers interact.
