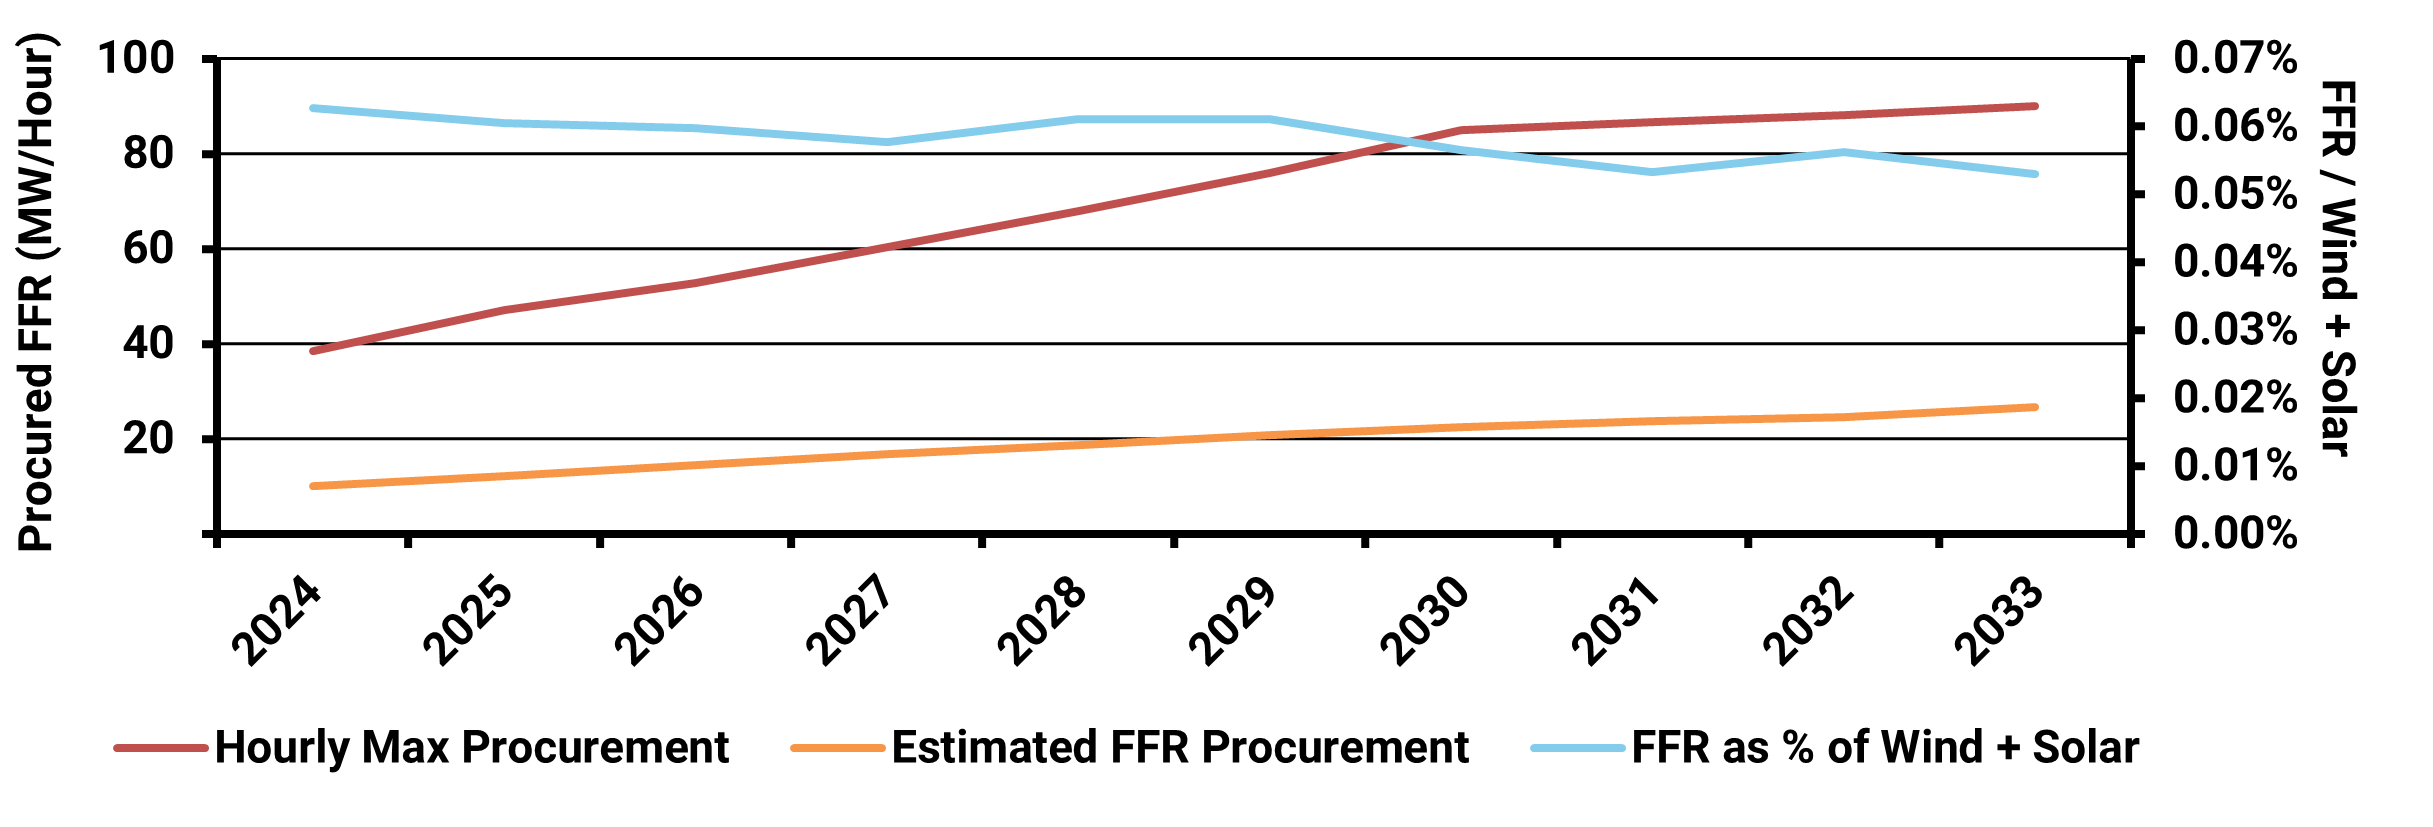
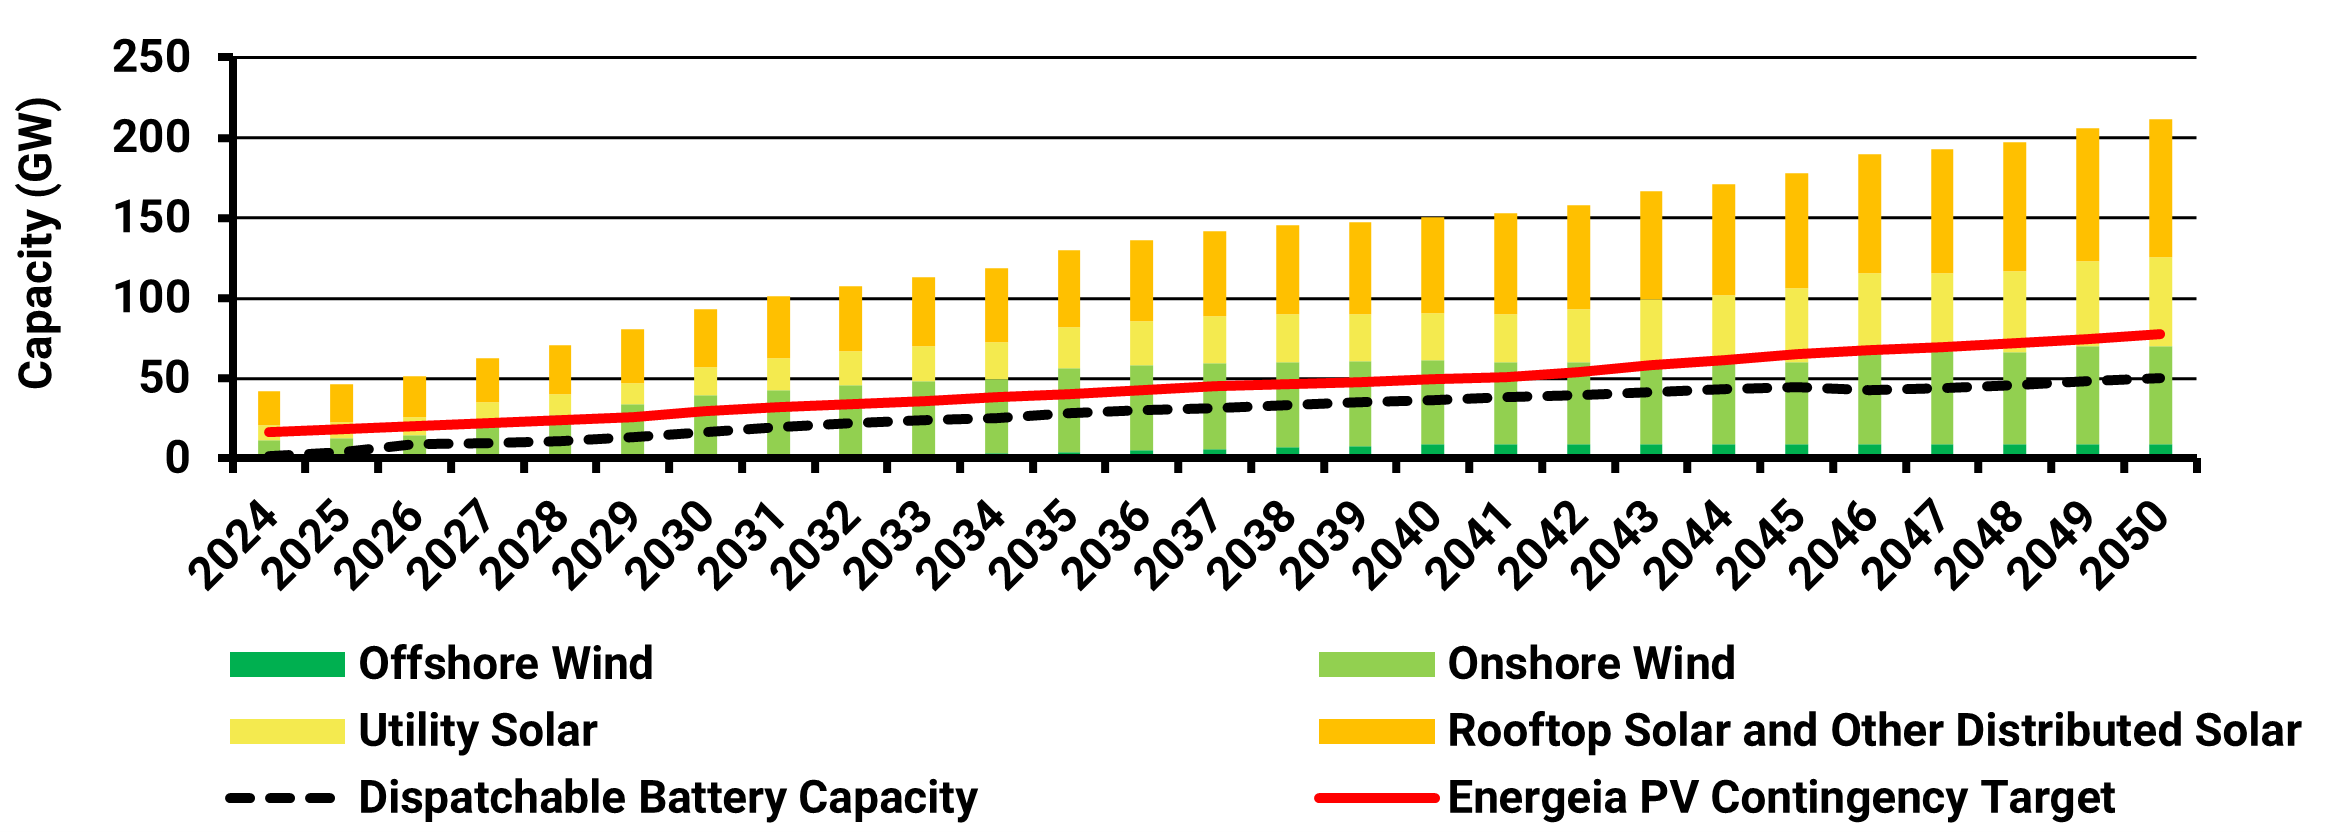
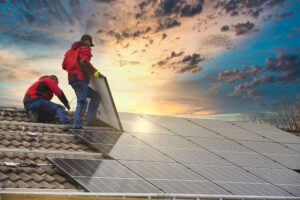
Unlocking the Potential of Consumer Energy Resources
The AEMC partnered with Energeia to explore how flexible Consumer Energy Resources (CER), like solar, batteries, electric vehicles, and smart appliances, can reduce costs and
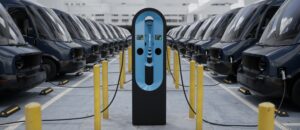
Optimizing DC Fast Charging Tariff Structures
Energy Queensland collaborated with Energeia to address financial barriers in EV charging infrastructure, focusing on high network tariffs and demand charges. The study evaluated alternative
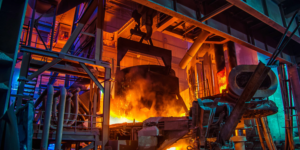
Industrial Decarbonisation: Hard-to-Abate Sectors
Examining hard-to-abate sector’s specific CO2 generation activities, fuel inputs, and viable decarbonization options, including electrification, is required to provide an accurate outlook on this critical