- Webinars
Removing Building Electrification Barriers
Buildings account for a significant portion of Australia’s and most countries’ annual emissions, mainly due to the burning of gas for water and space heating, and for cooking. Electrification of these end uses alongside power system decarbonisation is a key strategy for most countries. The main barriers to implementing these strategies includes:
- Higher cost electric appliances
- Higher electricity grid costs
- Industry capacity limitations
- Customer preferences for natural gas for cooking
The following sections describe best practice approaches to removing each of these barriers, based on more than 10 projects Energeia has completed in Australia and the U.S.
Australia’s Building Emissions and Electrification Potentia
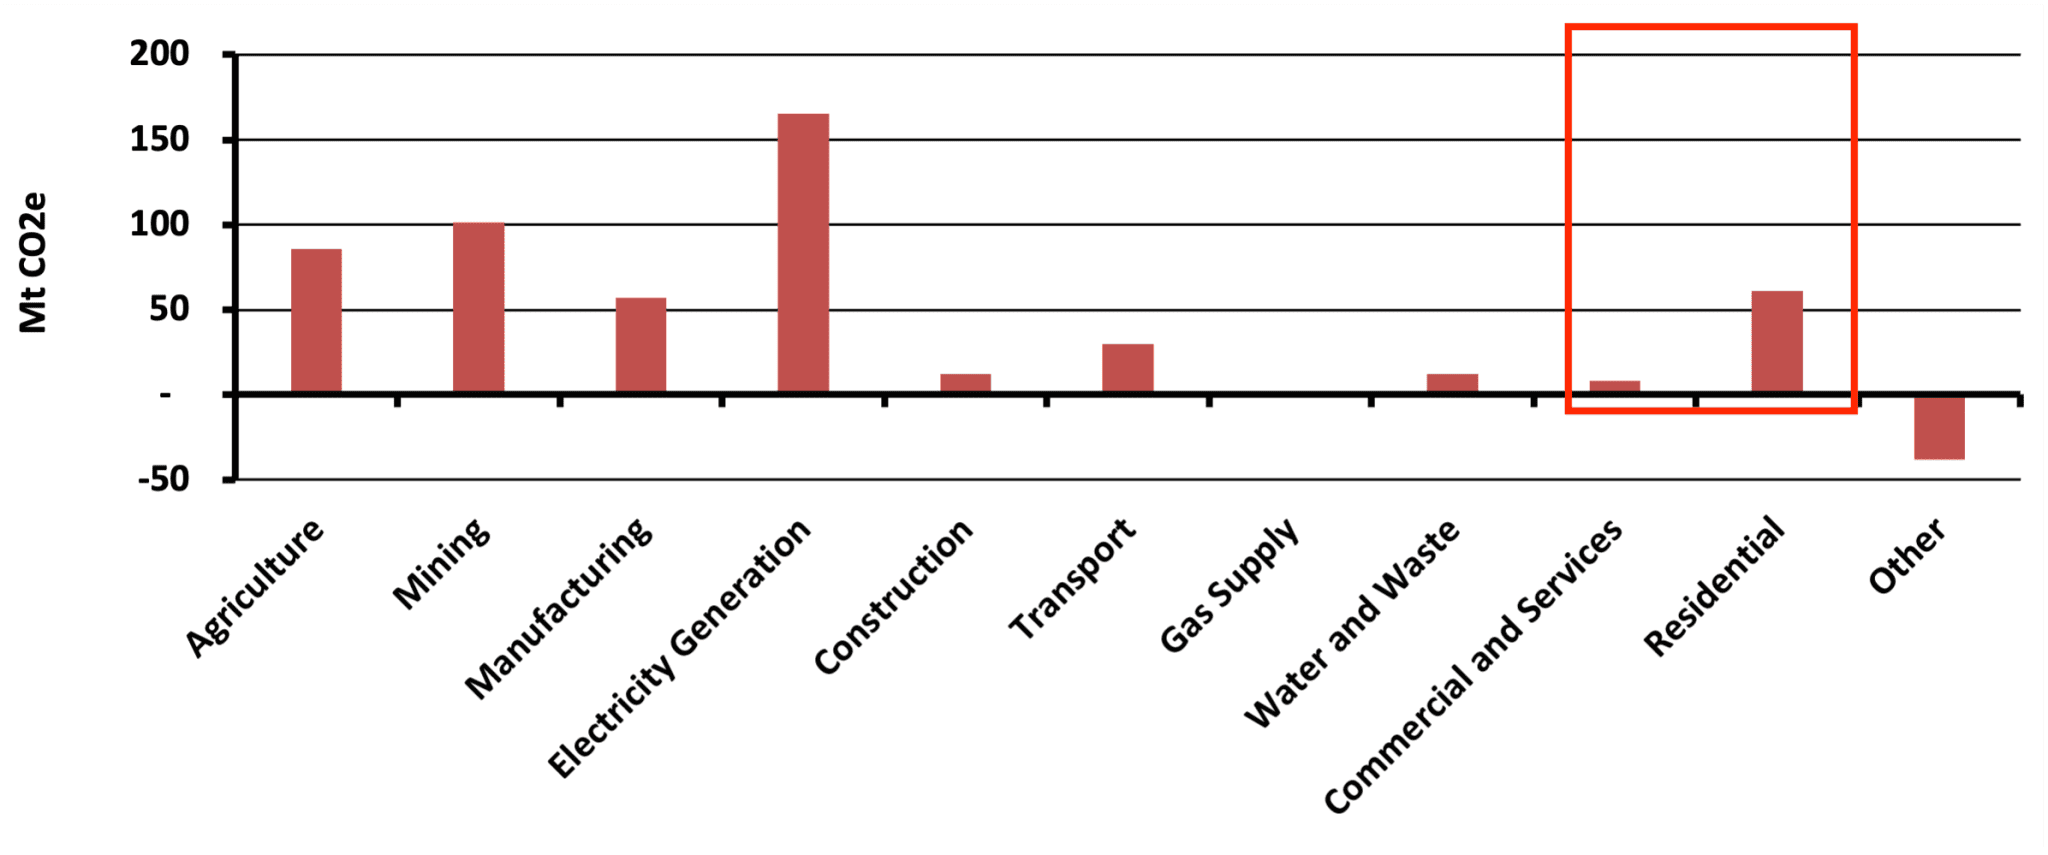
Australia’s buildings are the fourth largest source of emissions, after electricity generation, mining, agriculture and manufacturing. Most of the emissions comes from the residential building segment.
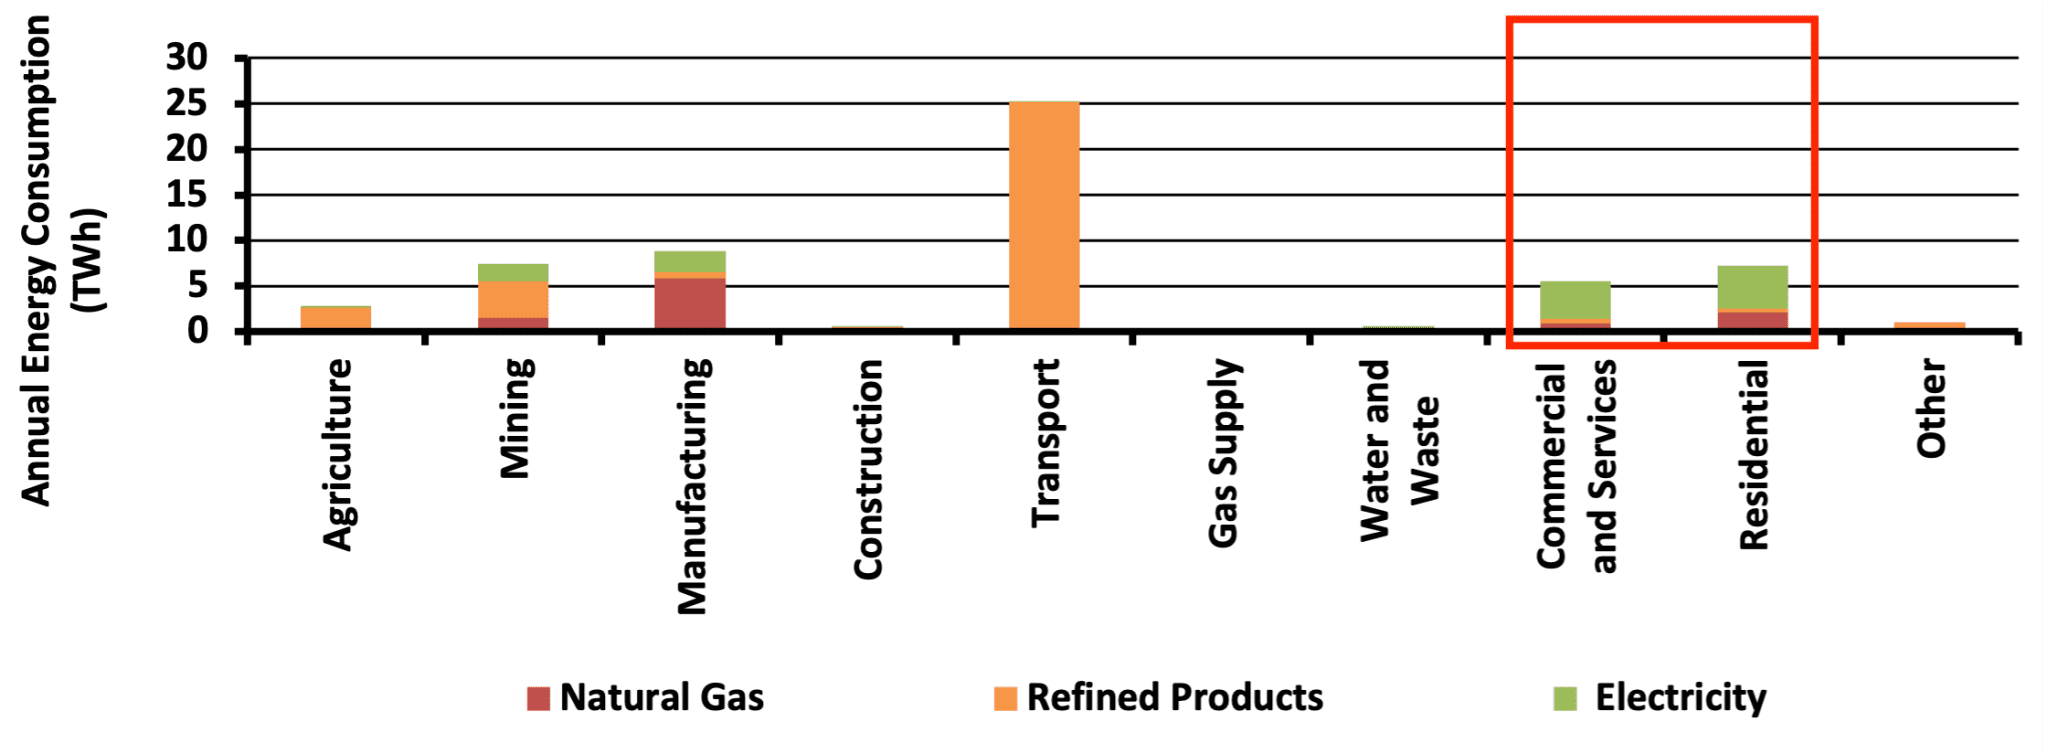
Emissions are generated by burning fuel or using electricity that burns fuel. The figure below shows that most energy used in in buildings is electricity, but the fourth highest amount by sector is used in residential buildings.
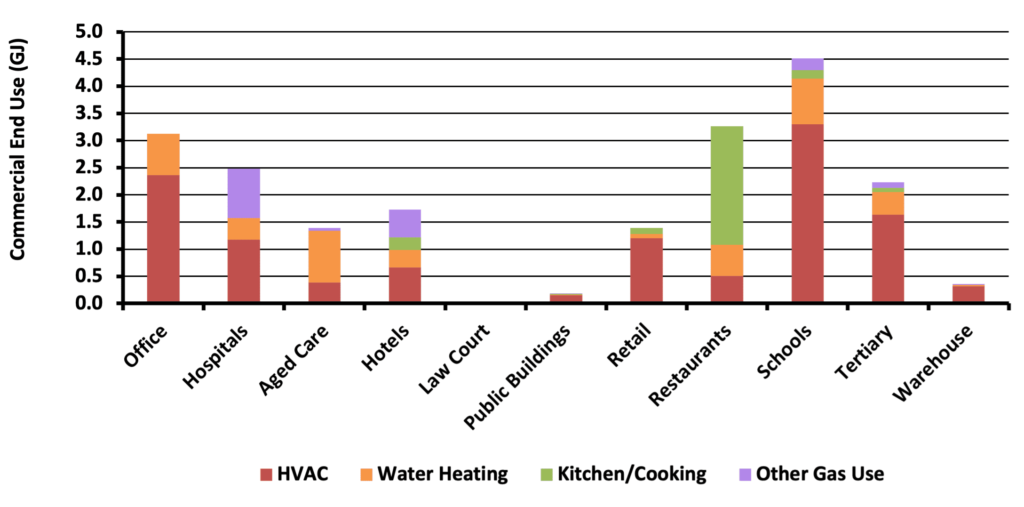
Diving into different types of premises, the data shows that gas is used quite differently. Electrification policies and programs therefore have a different impact, which will need to be taken into consideration during policy and program design.
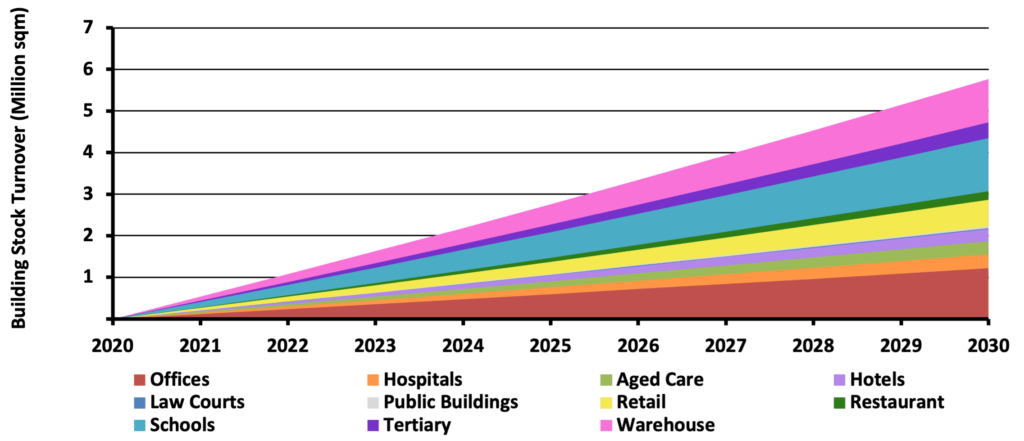
The pace of transition from the current state to a zero carbon, electrified future state, is governed by the rate of premise and equipment turnover, and the regulations and incentives in place, and the underlying technology and fuel costs.
Australia’s Building Electrification Potential
Australia’s rate of potential electrification of its building energy usage is primarily driven by:
- Rate of new premises – New buildings are an important market segment for targeting regulations, standards, programs and incentives.
- Rate of building remodelling – This usually triggers new regulations such as no new gas appliances, etc.;
- Rate of appliance turnover – Appliance bans can be at point of sale, but incentives can be used encourage voluntary electrification as well; and
- Retrofit programs – Almost never used due to their relatively high costs, they will become essential for the orderly decommissioning of the natural gas system.
The rate of new buildings and premises is largely a function of economic activity, and can be relatively easily gleaned from utility growth forecasts. New build is subject to prevailing building standards, but can also be influenced by programs and incentives.
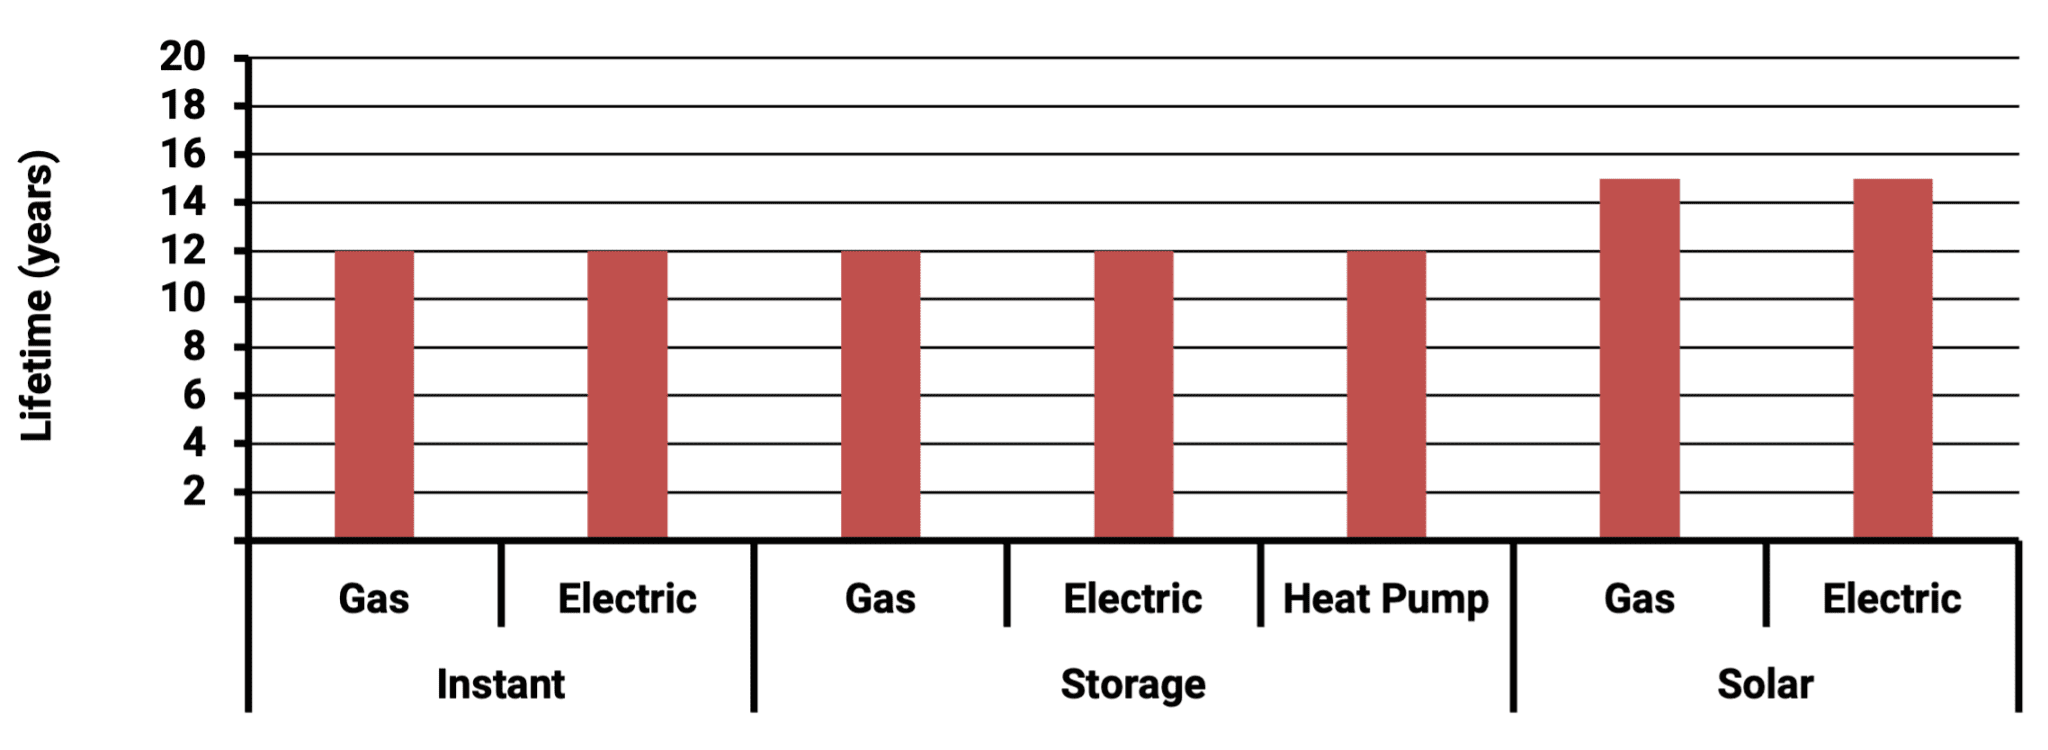
The rate of appliance turnover other than from major remodels is driven by appliance lifetimes, as most are replaced at end of life. The figure below for water heating technology shows there is not much difference between appliance lifetimes. However, another key insight from this data is that once installed, there will not be another chance to electrify them for over a decade.
Listen or click through at your own pace
Turning the above drivers of potential electrification into actual electrification depends on overcoming the key barriers foreshadowed earlier.
Addressing Appliance Cost Barriers
Differences in upfront costs for gas vs. electric equipment and appliances are a key barrier for anyone with:
- capital constraints; or
- where there is a split incentive between the owner and the occupier of a premise; or
- where the value of the investment cannot be fully recouped, for example due to only being in the premise a few years compared to a 12 year investment horizon.
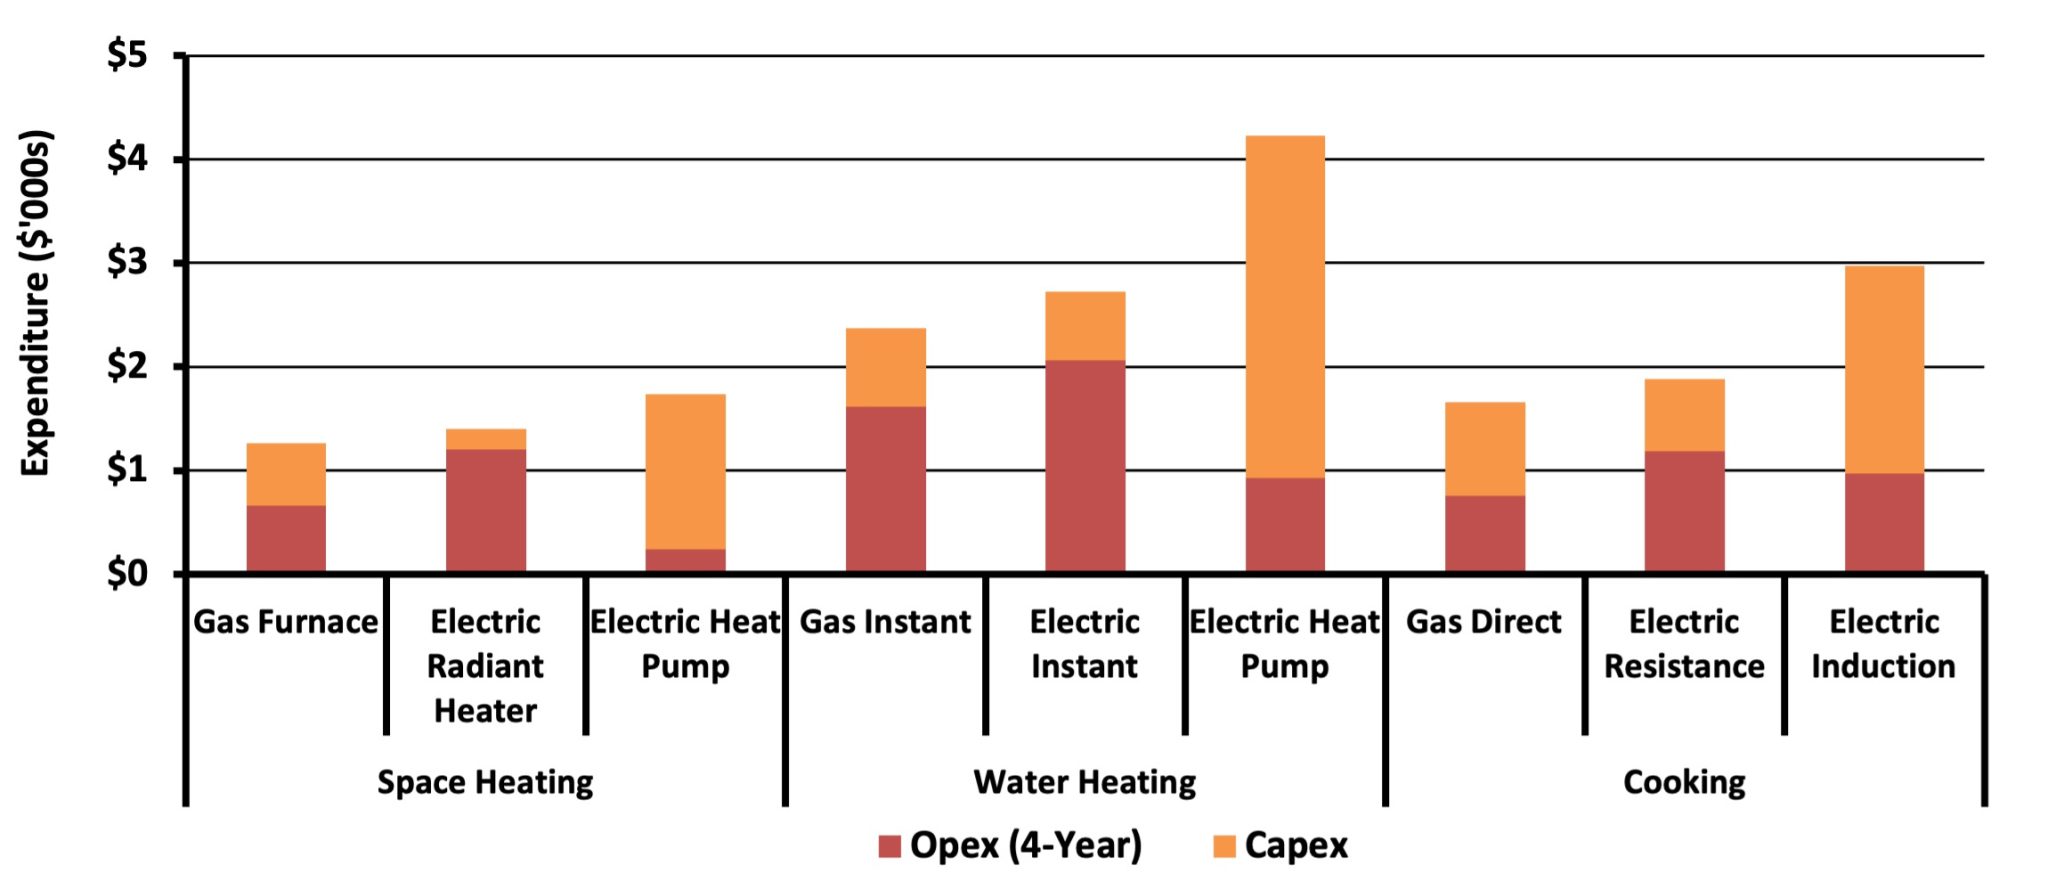
The figure below shows expenditure relativities between different options for a 4 year investment horizon, which mainly reflects the average home ownership and commercial lease tenancies. It can be seen that gas in this case (and results are highly sensitive to local conditions such as gas and electricity relativities), is generally the least cost option. Heat pumps, which may be more cost effective over a 12-year period, are unlikely to be selected by rational investors, due to their bounded conditions such as tenancy duration and the inability to recover the residual value in the resale value of the premise, or via a deal with the landlord.
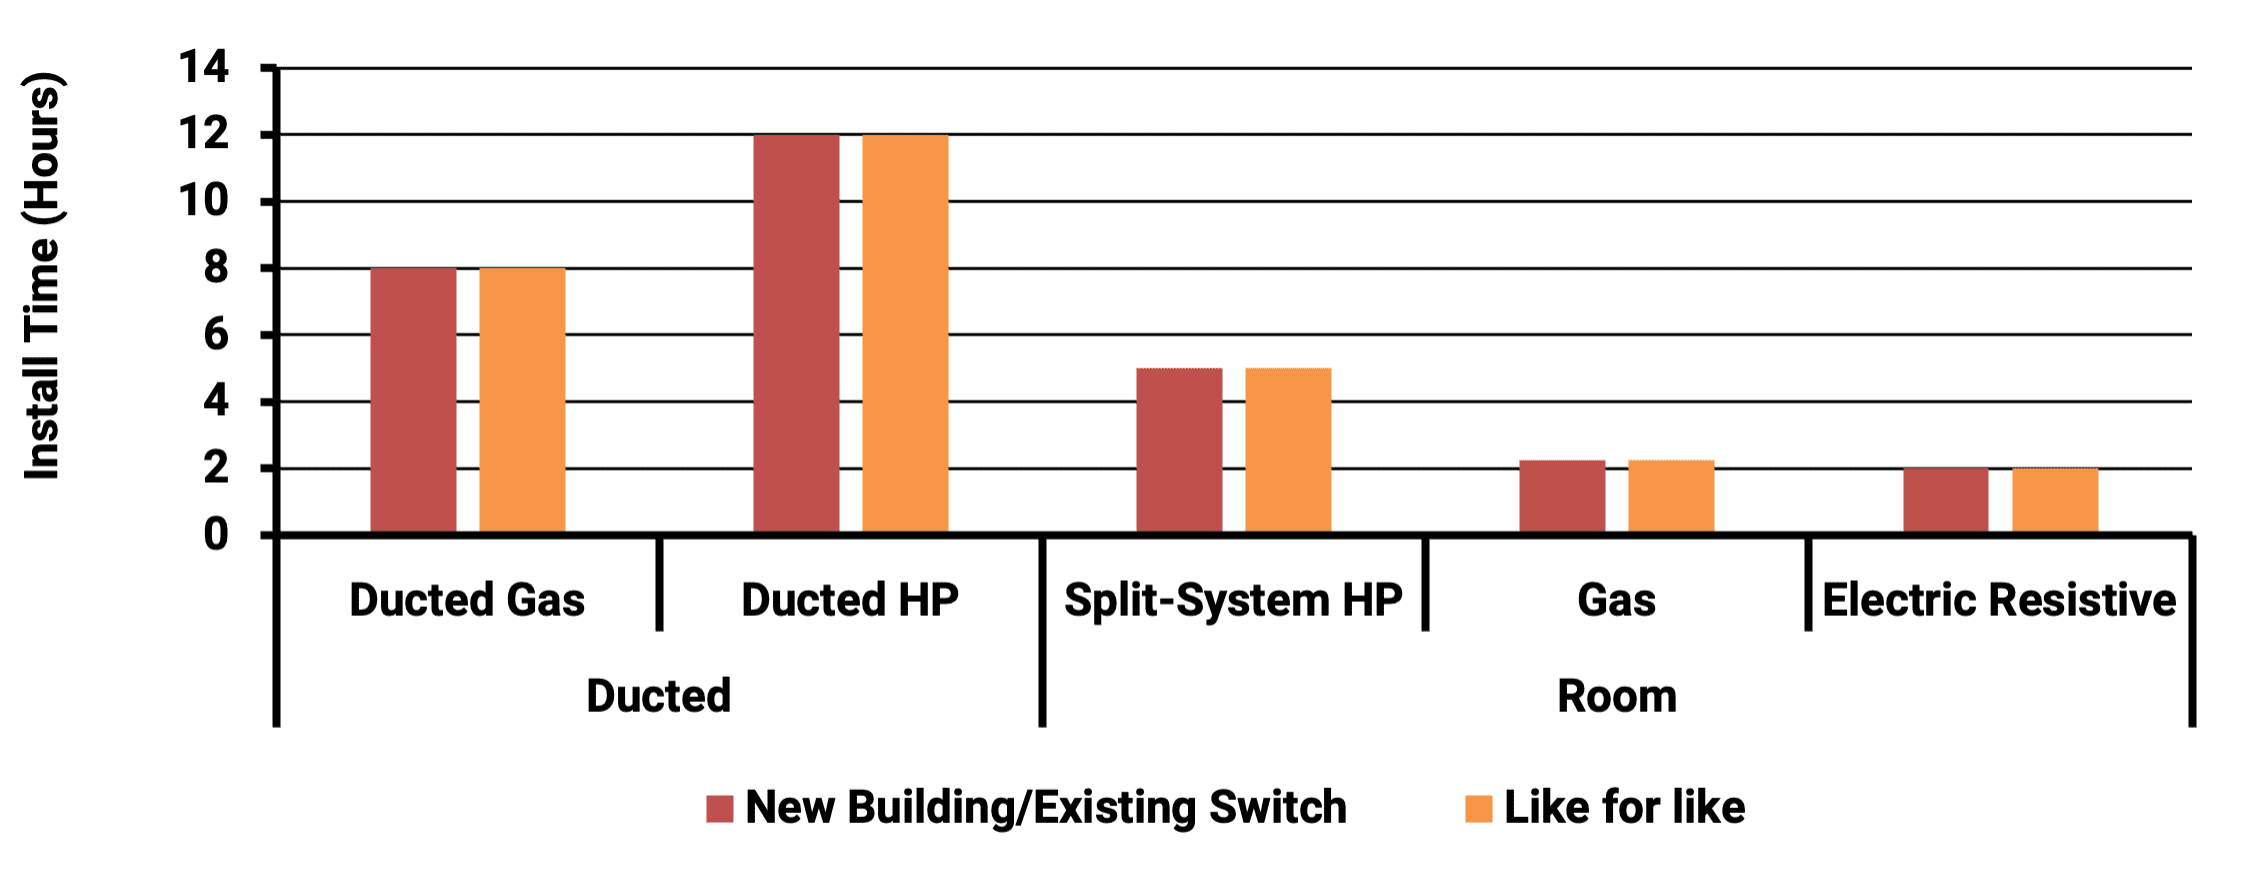
A common misperception about the relative costs of electric and gas space heating options is that installation costs when switching are much higher if not like for like. The reality that Energeia found when interviewing installers is that the duct work largely needs to be upgraded to be brought up to the latest code, even when replacing a like-for-like system.
Best practice building electrification programs either ban options that are known to be a bad investment, e.g. resistive ducted or water heating systems, which can unfairly force costs on to current premise owners (who may only be there for 4 years), or, provide financing or other incentives to better align the costs and benefits over time.
The most appropriate policy and regulatory framework depends on the situation, with the presence of government owned gas and electric utilities leading to a very different optimal policy and regulatory solution than where they are privately held, for example.
Addressing Industry Capacity Barriers
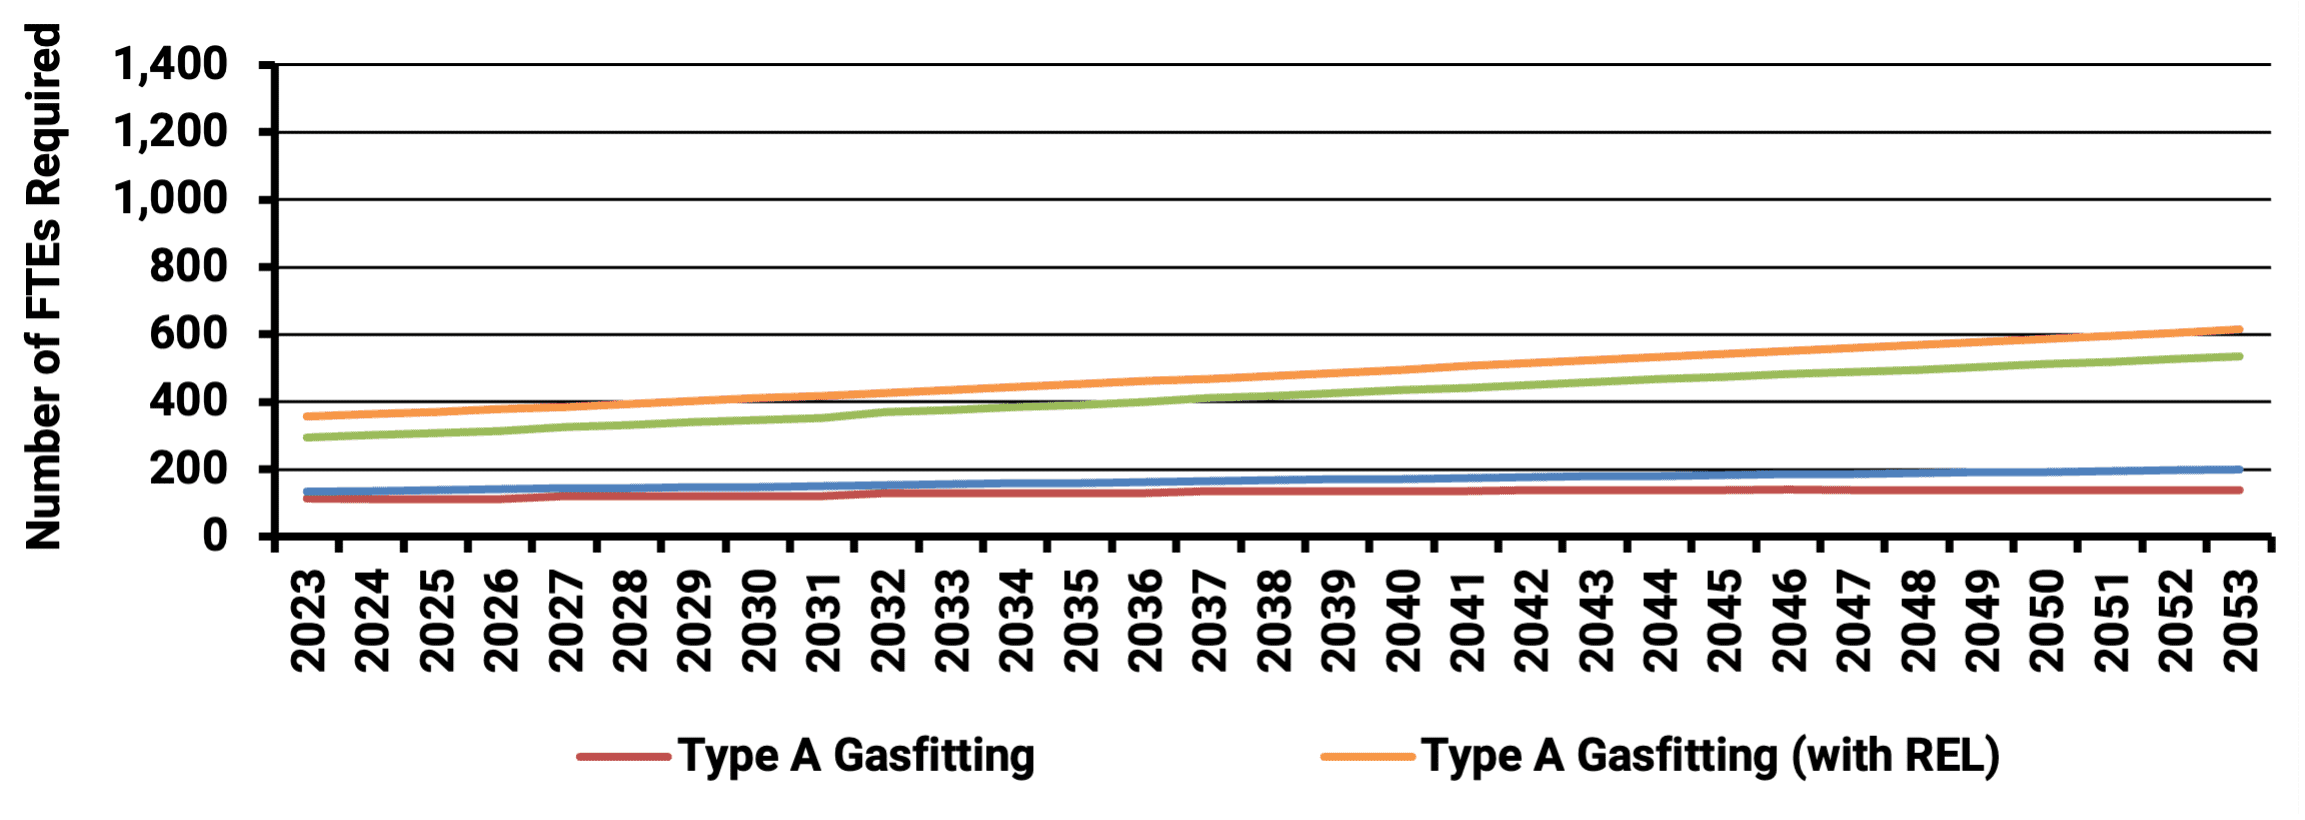
Another key issue facing policies and regulations that band appliances that are currently a major portion of the market is the impact on the installation industry. The figure below shows the relative impact of different combinations of bans on the demand for different trades.
Of course, any significant changes to market conditions need to be communicated to the industry in a timely fashion. We have worked with clients to identify and engage with the workforce training elements of the economy to ensure sufficient retraining capacity is available.
Best practice approaches we have developed with clients is to start with incentives to encourage a more gradual increase in electrification over a period to a notified future ban on targeted technologies, which are themselves staggard.
Addressing Grid Impact Barriers
Beyond the owner and industry barriers, the impact of electrification on the electricity system can be a significant barrier, particularly where tariffs are not cost reflective, and higher electricity system costs fall on existing rather than transitioning demand.
The figure below provides an illustrative example, average electrification impact by end use. It shows that space heating could lead to a higher peak in the morning, where most electricity peaks in Australia are driven by summer air-conditioning load after solar PV output declines.
As long as the new load is not creating a new peak demand, it leads to a general fall in electricity prices, as new demand is able to share the cost of existing infrastructure. However, once it eats of this capacity, electrification becomes the key drive of capacity expansion costs.
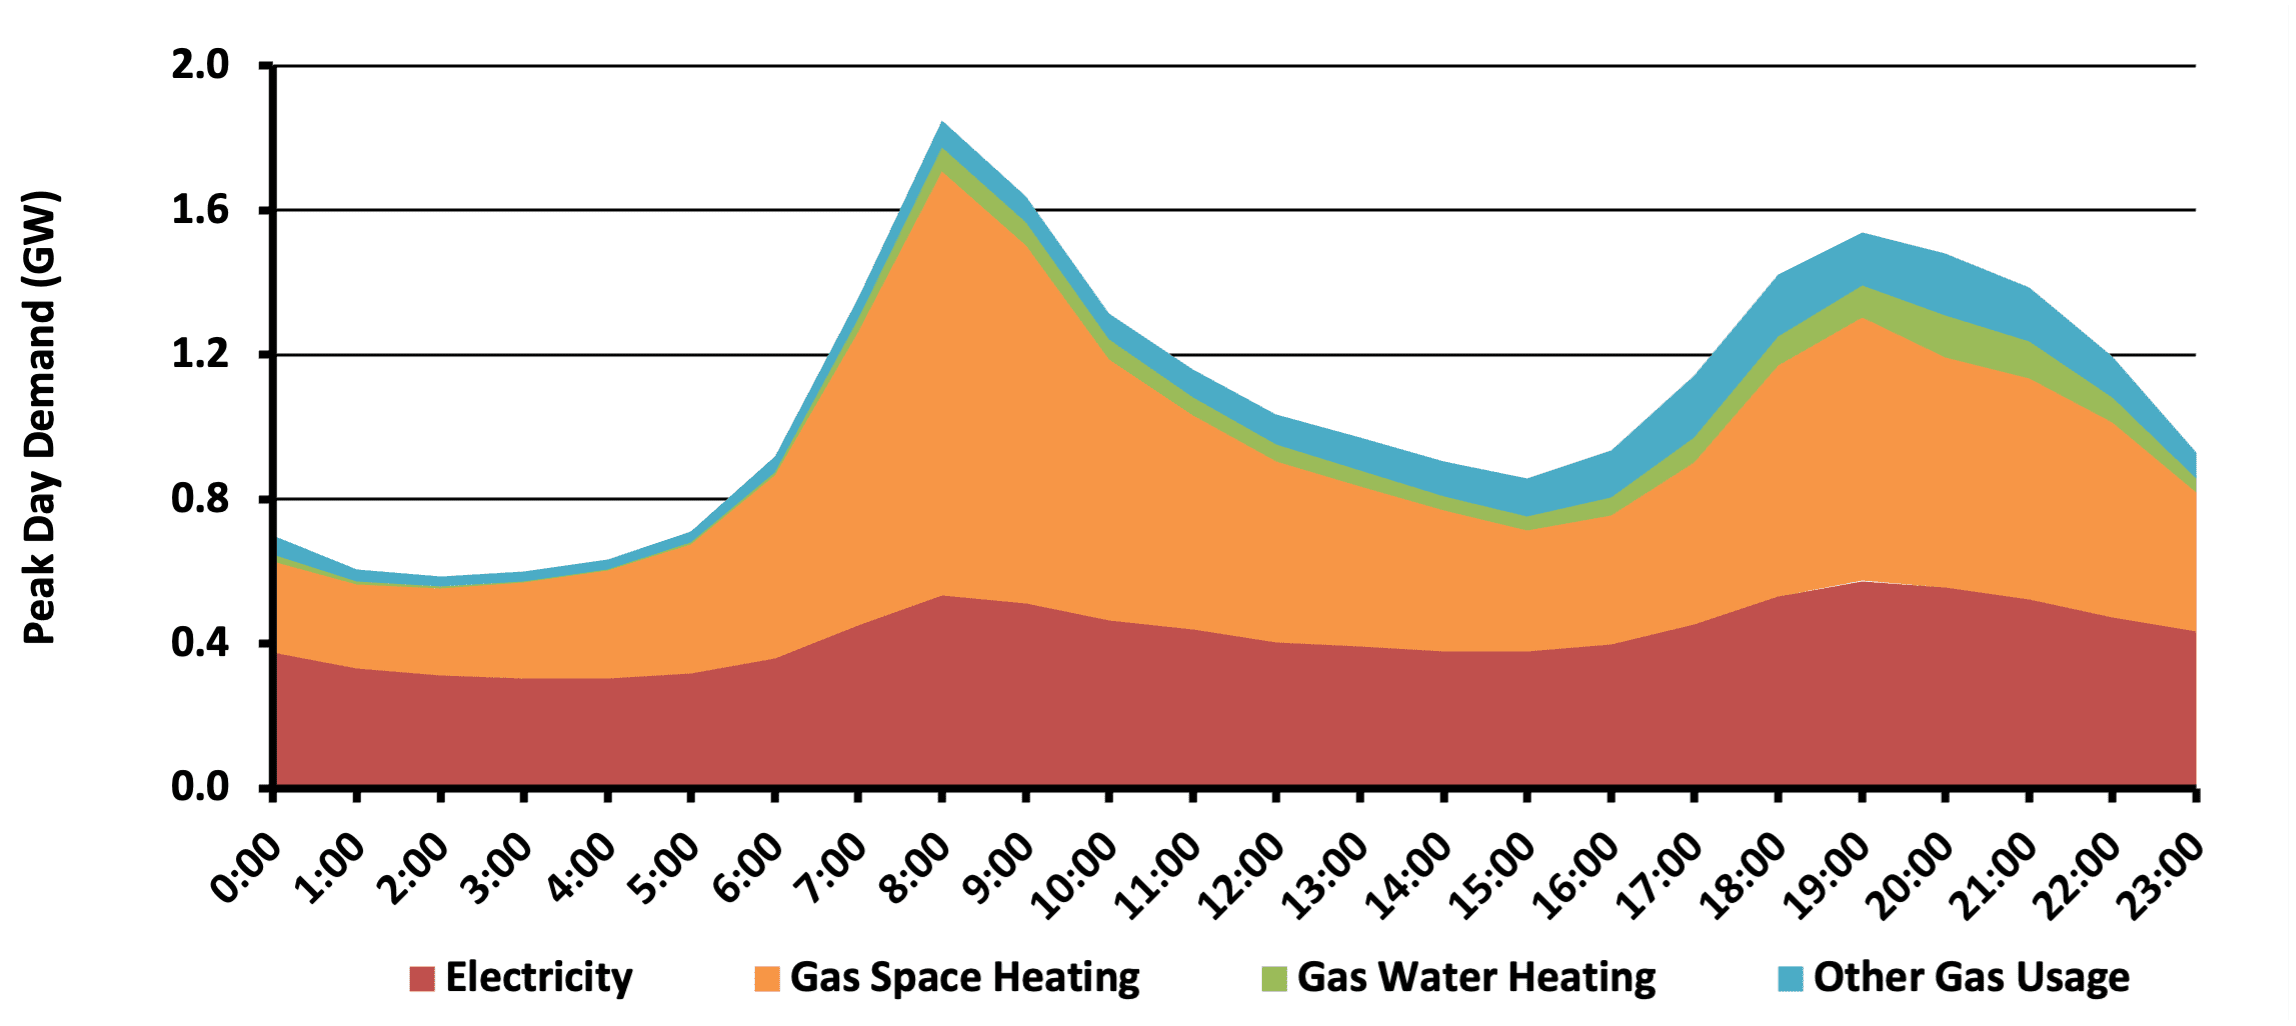
A key assumption in the above estimate is the mix of resistive vs. heat pump technology and the mix of instant rather than storage water heating technology. Resistive technology uses 2-3 times more electricity for space and water heating, and will drive a much higher morning peak, as does instant compared to storage water heating technology.1
Best practice approaches to addressing the above barriers include regulations and incentives that encourage more heat pumps (which are storage in nature), a reduction in heat pump costs (e.g. via R&D incentives), and discourage electric boosters in them.
Other best practice approaches focus on driving greater overall electric load flexibility via adoption and operation of the devices shown in the figure below, i.e. rooftop solar PV, batteries and controllable loads such as at premise electric vehicle chargers and heat pumps.
Implementing the above best practices will have a major impact on the overall cost effectiveness of
Addressing Program Funding Barriers
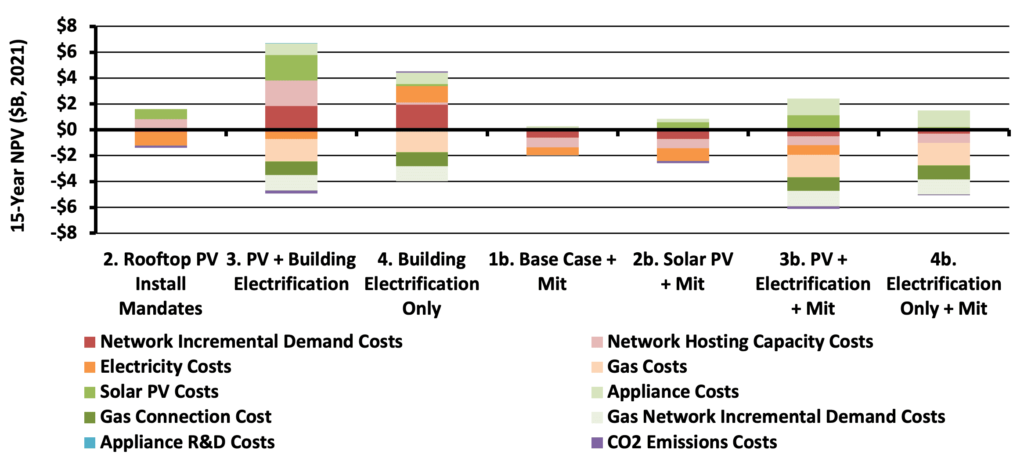
Combined effect of implementing best practice approaches to barrier removal has a dramatic effect on a given community’s costs and benefits from building electrification, as illustrated by the example outcomes across a range of base and optimized policy scenarios shown below. The whole-of-system and stakeholder impact analysis showed that two out of the 3 base policies resulted in a significant net cost increase. However, implementing best practice mitigation strategies resulted in the lowest overall cost, which was a significant savings compared to the ‘Do Nothing’ scenario (against which other scenarios were compared).
Takeaways and Recommendations
The cost impacts of electrification occur upfront, while the benefits occur over a longer period, up to 10-years or more. They can also impact on the owner and occupier differently, due to differences in tenancy duration and ownership. Addressing these barriers requires being able to access financing in a manner that accommodates changes in tenancy.
Best practice, self-funding strategies we have worked with clients to identify and implement includes:
- Providing rebates or financing that address upfront cost differences, and recovering these costs via higher electricity or other techniques to better allocate costs
- Accessing CO2 or energy efficiency (which also translates into CO2 savings once the wholesale market is decarbonised) credits
We have also seen policymakers look to the tax base, including via bonds, to provide financing. However, we have found that this has not been necessary to date, due to the availability of longer-term operating cost savings, and ability to use energy pricing mechanisms for funding.
That being said, a key cost that has not yet been tested in Australia and only in very limited cases in the US, is the cost of gas network decommissioning. This is likely to entail rollout, which will be relatively high cost, and likely to need to be compensated.
Energeia encourages careful analysis of net benefits from electrification, and considering policies that better captured excess benefits, so that they may at least partially fund the full cost electrification, including gas system decommissioning as appropriat
hile beneficial overall due to lower energy costs over time in every jurisdiction that Energeia has analysed, impacts from building electrification vary widely across premise types, consumer tenancy types and time. Best practice policymaking and regulation focuses on mitigating the downsides, in part via capturing a portion of the potential upside.
Key Takeaways
- Building electrification is an essential part of Australia’s decarbonization pathway
- There are four main electrification triggers: new build, replacement, end-of-life and retrofit
- Building electrification impacts different consumers differently
- Key barriers to electrification are higher upfront costs, higher grid costs, industry capacity constraints, and program funding
Key Recommendations
- Use bottom-up modeling of premises at the sub-load level to provide granularity needed to identify and size the key barriers and solutions
- Overcome cost barriers via financing or rebates, recovering these costs from imposts on electricity usage aligned with expected benefits
- Address potential industry labour constraints by giving industry plenty of notice, staggering any bands to minimize step changes in demand, and ensuring retraining capacity
- Overcome electricity grid cost barriers by ensuring cost reflective pricing avoids cost shifting and cross-subsidies, and encouragement of load flexibility and management
- A largely unknown key risk is the cost of gas network decommissioning, which Energeia believes could be at least in part funded by repurposing electrification benefits
For more detailed information regarding the key challenges of analysing and optimising building electrification, best practice methods, and insight into their implementation and implications, please see Energeia’s webinar and associated materials.
For more information or to discuss your specific needs, please request a meeting with our team.
You may also like
The Balance of Ancillary Services Pricing
FCAS exist to provide AEMO with operational reserves in case of unplanned variations in demand and supply to keep demand and supply of electricity in

Energeia Assists AEMC on Potential Rule Change
The Australian Energy Market Commission (AEMC) has proposed draft rules aimed at transforming how power companies and consumers interact.

State of the Art in Virtual Power Plants (VPPs)
Electrification of appliances and transport will radically change the optimal grid and bulk system configurations. What is a solution for managing all these resources without
