- Webinars
Optimizing Electric Vehicle Incentives
Emissions from Road Transportation Second Highest in Australia
Australia and most Australian states have committed to net zero emissions by 2050. Victoria and the ACT have committed to net zero emissions by 2045. Under the Paris Accord, countries are required to periodically assess the cost of achieving targets and to increase targets where costs have fallen.
Achieving these targets will requiring reductions across the Australian economy. The figure below shows that electricity and stationary energy account for the lion’s share of current Australian emissions, with transportation being the next largest source of emissions.
Within the transport sector, road emissions account for 87% of total emissions, and current business-as- usual (BaU) forecasts by the Department of Environment and Energy see the share falling slightly over time.
Finally, within the road transport subsector, passenger vehicles currently make up 55% of total sector emissions, but their share is expected to fall slightly to 2030 under Department of Environment and Energy’s BaU forecasts. The next highest sources of road emission are light commercial vehicles, following by articulated and rigid trucks. Buses make up only a small fraction of the total, and emissions from motorcycles are negligible.
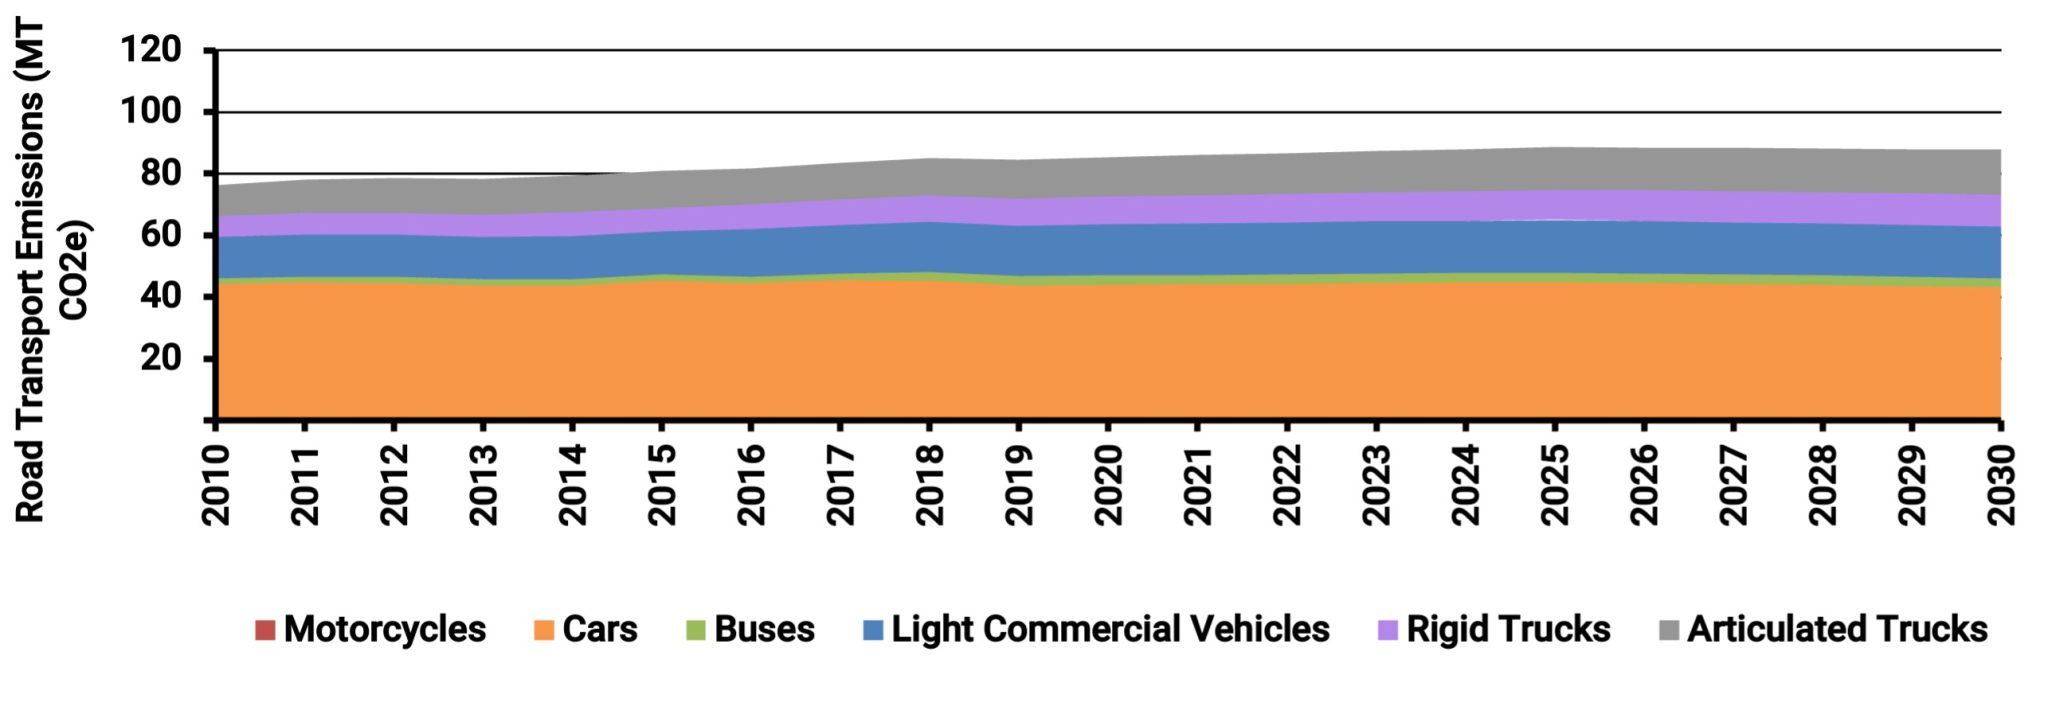
Based upon the above analysis, the transport sector’s pro-rata[1] achievement of the Federal Government’s reduction targets by 2030 would require a 50% emissions reduction. The target rises to 75% for the leading state jurisdictions of VIC and the ACT.
Current Forecasts Fall Short of Emissions Reduction Requirements
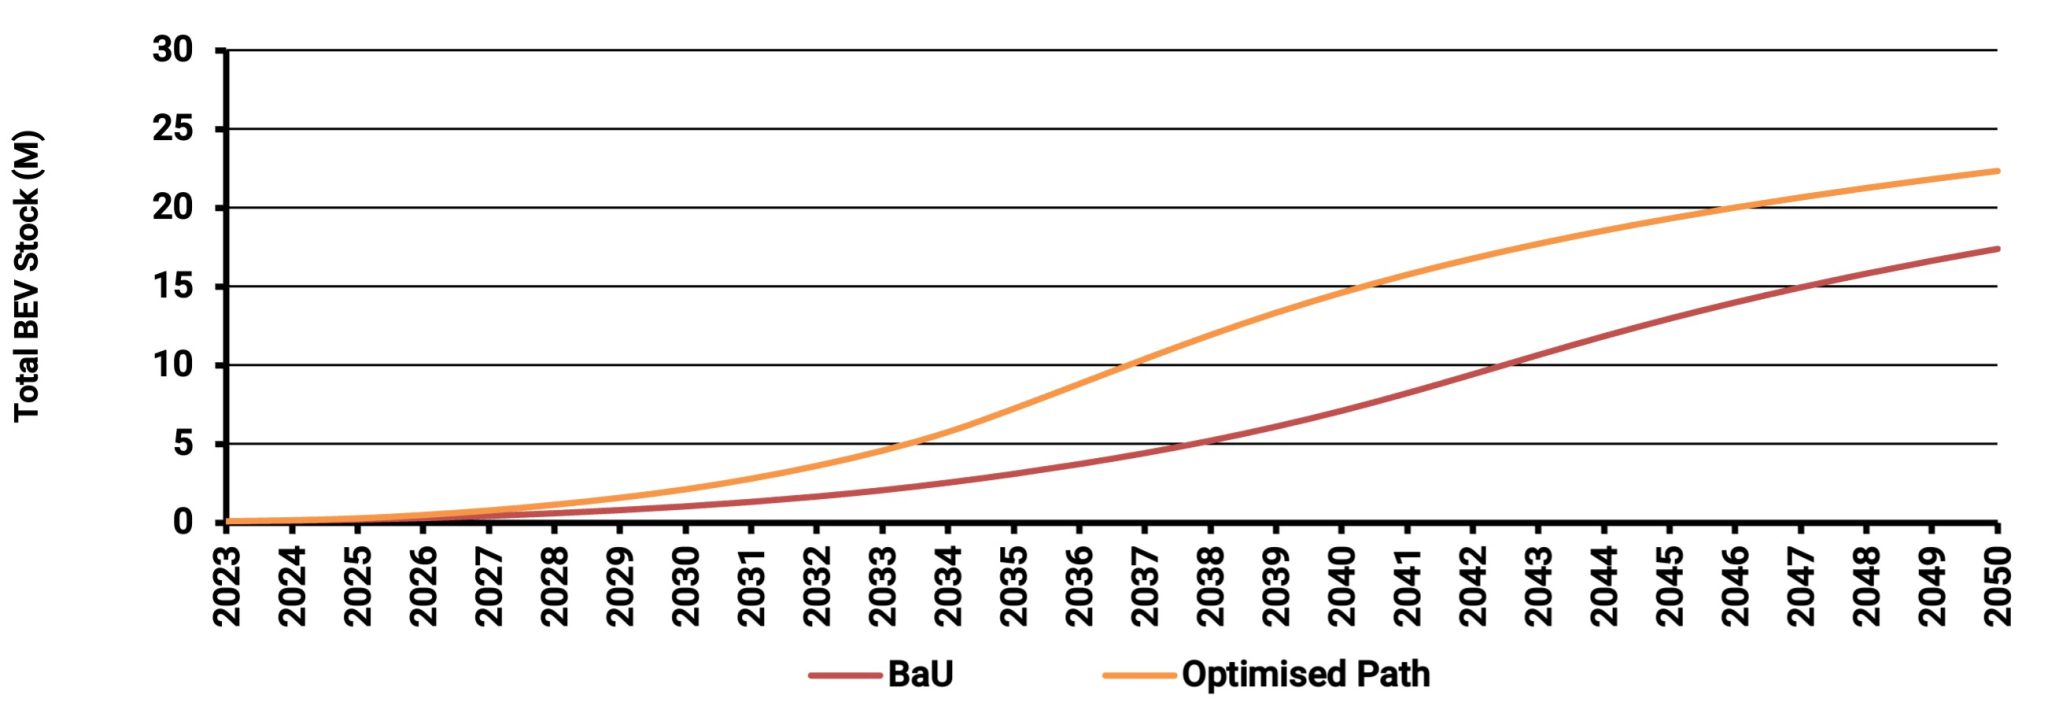
Energeia’s latest forecast of EV adoption under a Current Settings scenario across the NEM shows road transport achieving around a 10% reduction by 2030, rising to a 25% reduction by 2040, and 80% by 2050. However, our Optimised scenario shows uptake accelerating much more quickly. AEMO’s highest scenarios are consistent with our Best Practices scenario.
Key Barriers to Adoption Include Vehicle Choice, Performance, Cost, and Charging
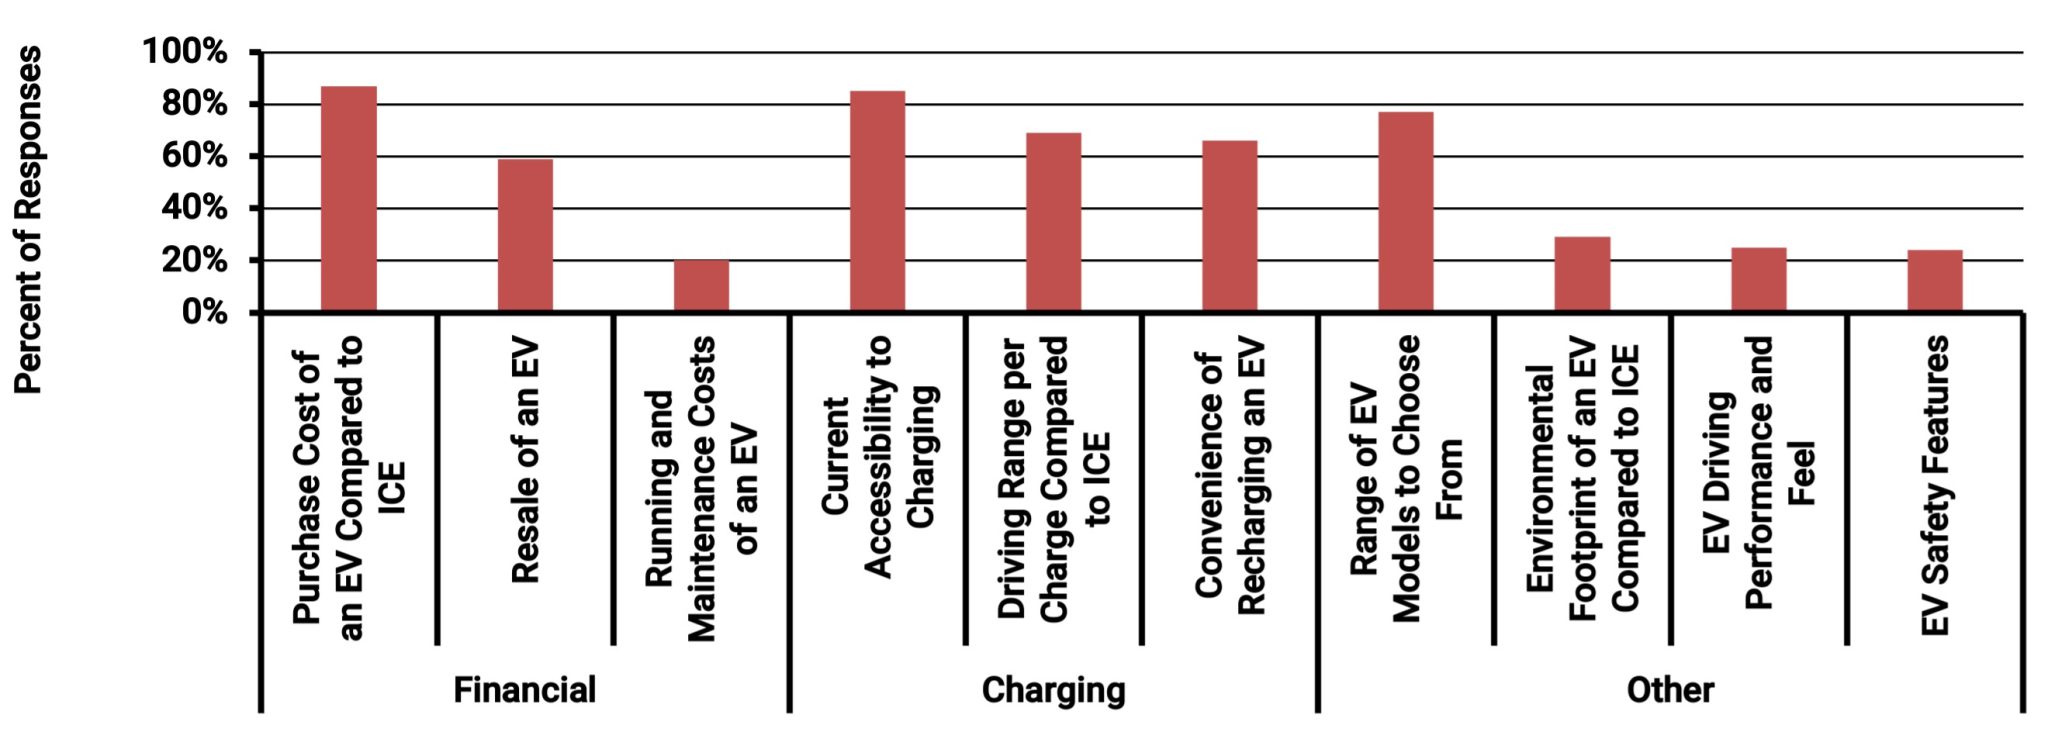
The key to achieving the Optimised scenario level of EV adoption lies in addressing the key barriers. The figures below report on the barriers reported by owners of passenger and commercial vehicles, which can be summarised as:
- Financial – Mainly upfront premiums
- Charging – Mainly availability
- Performance – Mainly range
- Suitability – Mainly applies to commercial and government applications
Adoption Forecasting
Energeia has been forecasting EV adoption for over a decade, and our forecasting model has evolved over this time significantly, and now uses the following primary factors to forecast EV adoption:
- Vehicle Economics – What is the payback to convert to an EV?
- Vehicle Availability – What is the percentage of vehicles available in an EV?
- Charging Availability – What is the availability of public charging for those that need it?
- Grid Availability – What is the availability of the grid to connect EV load?
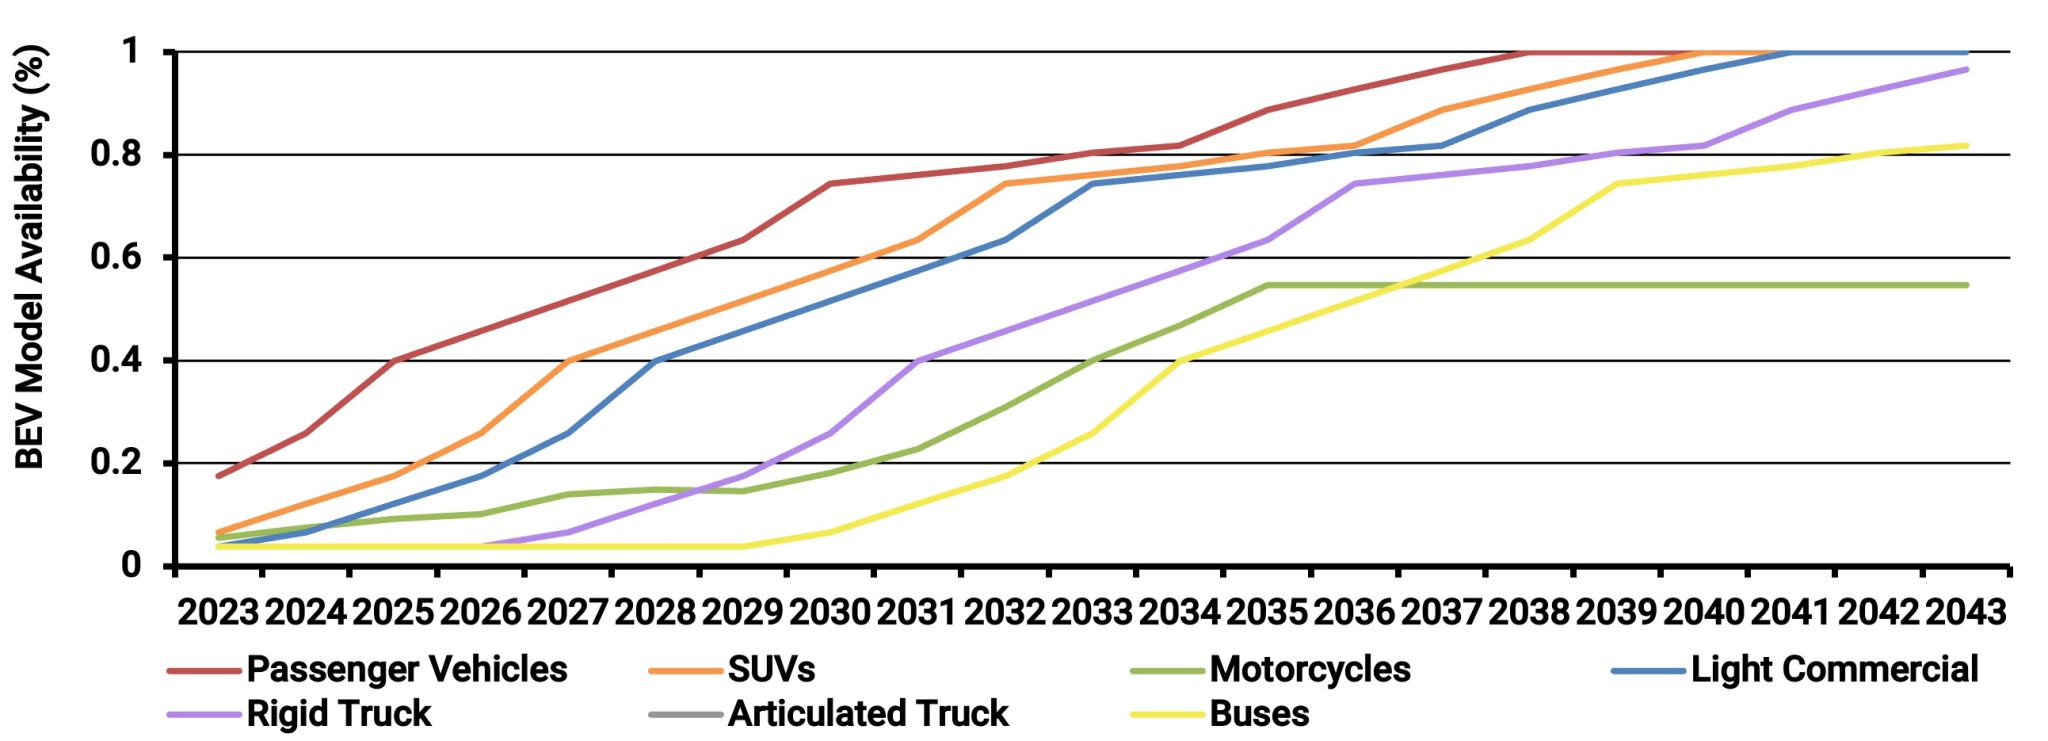
The figure below shows our current view of EV availability over time by class relative to the total number of vehicle makes and models. It shows 80% of cars being available as an EV by 2030, but a much lower rate for commercial vehicles. Energeia notes manufacturers appear to be accelerating their introduction of new EV makes and models, and we are working on updating our view accordingly.
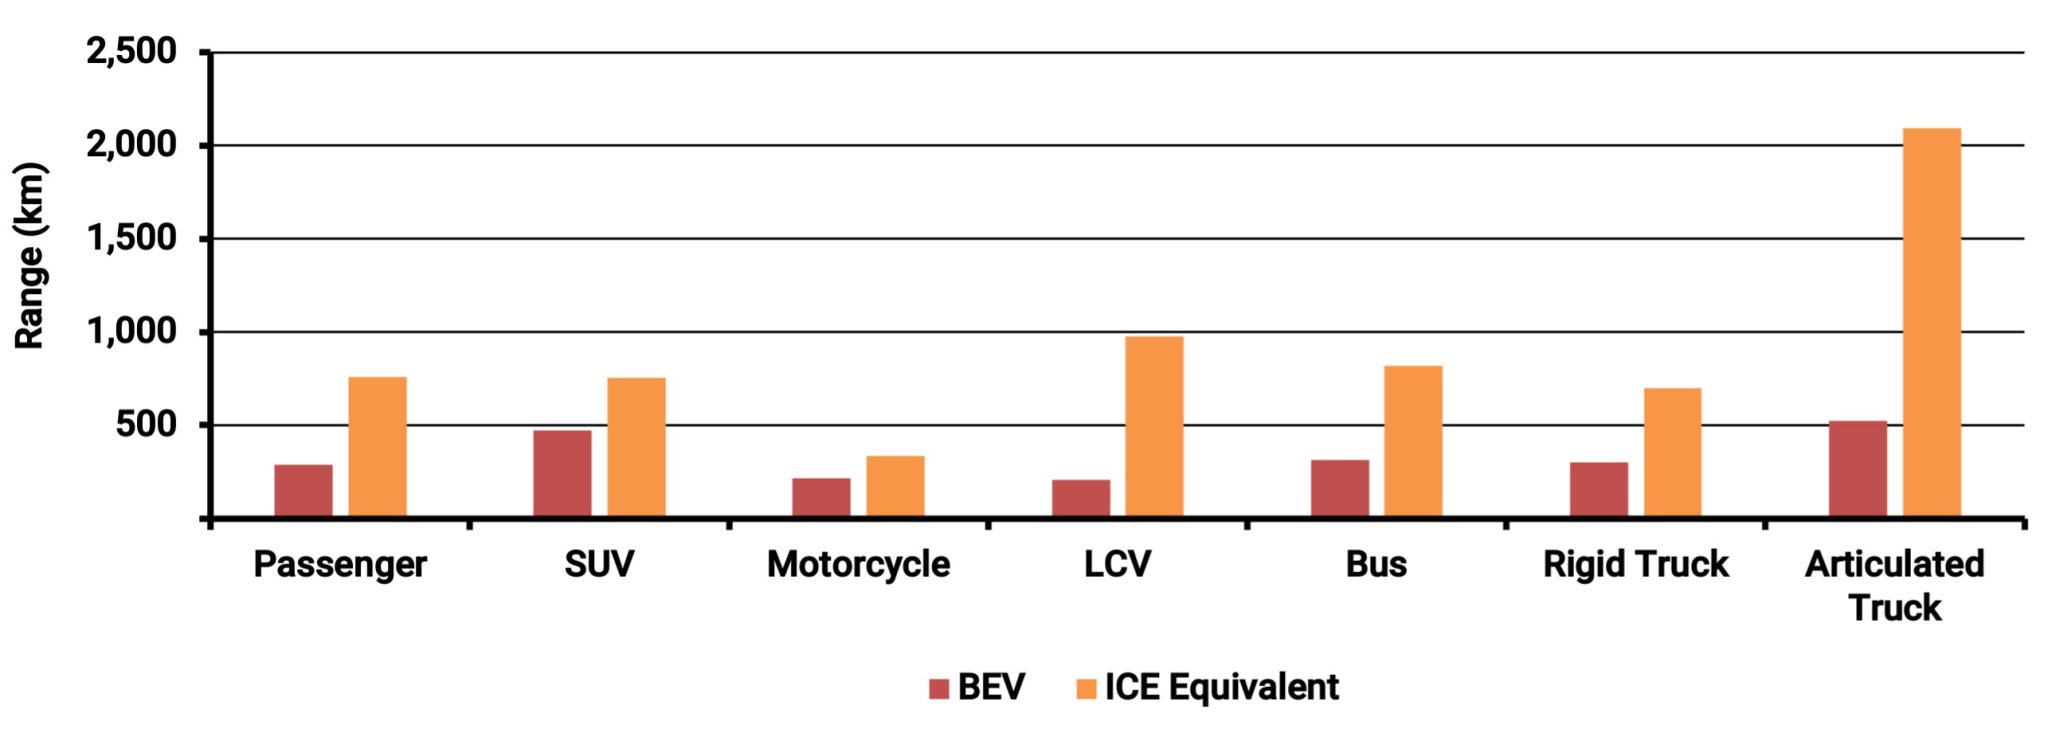
In terms of range performance, the figure below shows current typical BEV ranges compared to Internal Combustion Engine (ICE) vehicles. Energeia’s view is that BEVs, especially commercial vehicles, are likely to fine tune distance with duty cycles, which are much lower than ICE ranges, do their impact on cost but also gross carrying capacity.
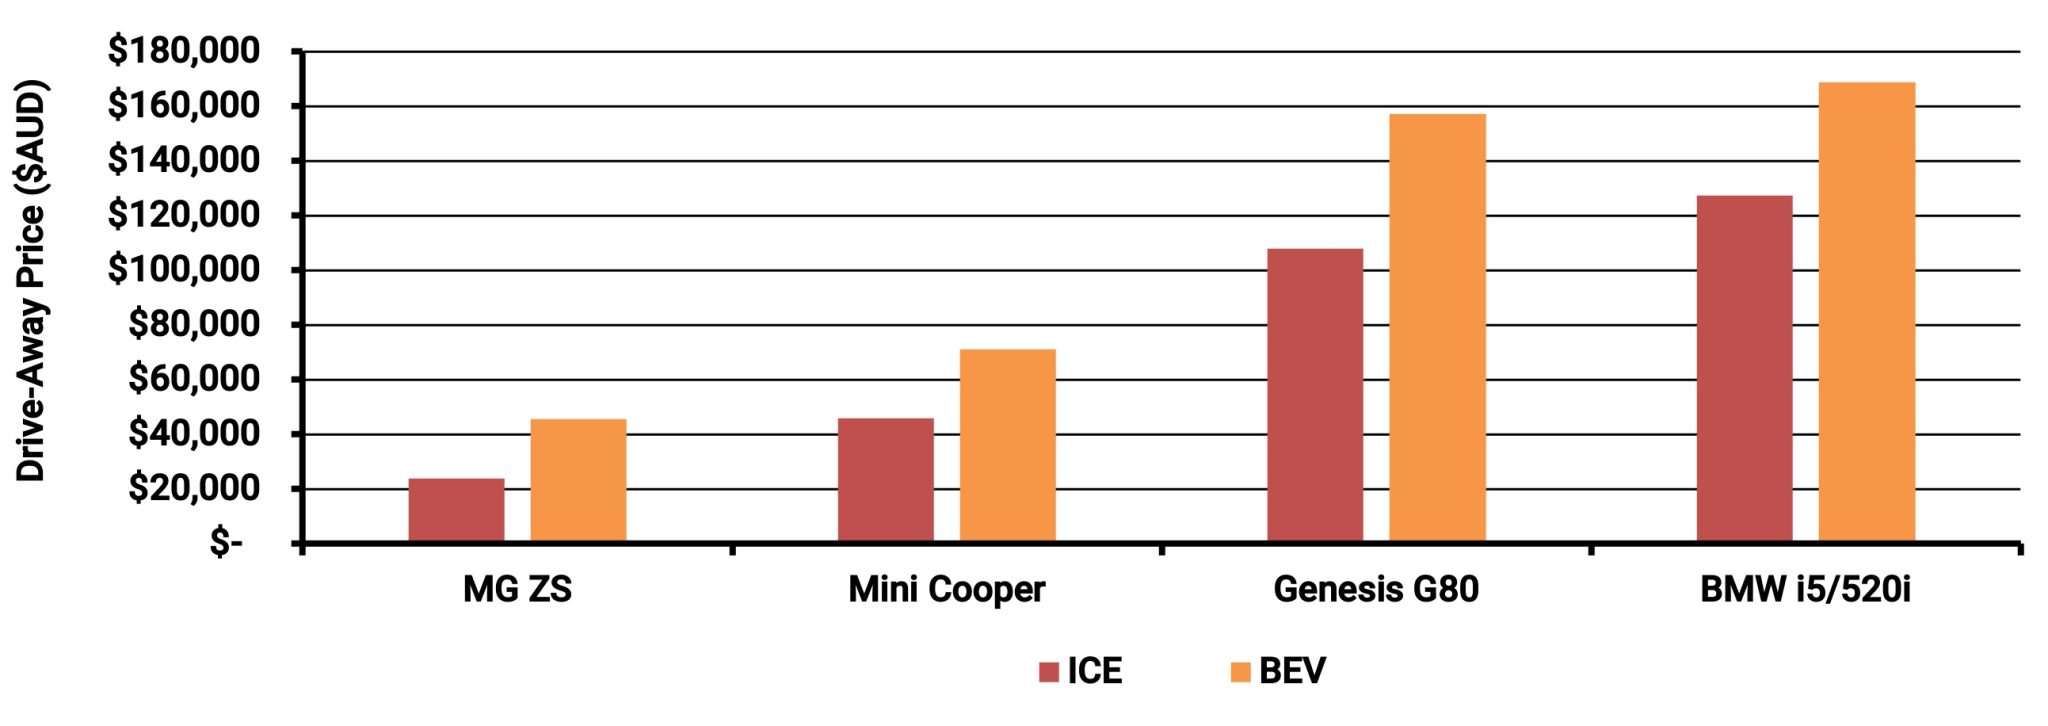
BEV pricing premiums to identical ICE vehicles are shown below before any rebates or electric vehicle incentives. BEV pricing premiums are mainly driven by manufacturing scale and battery costs, which are both rapidly improving in favor of BEVs.
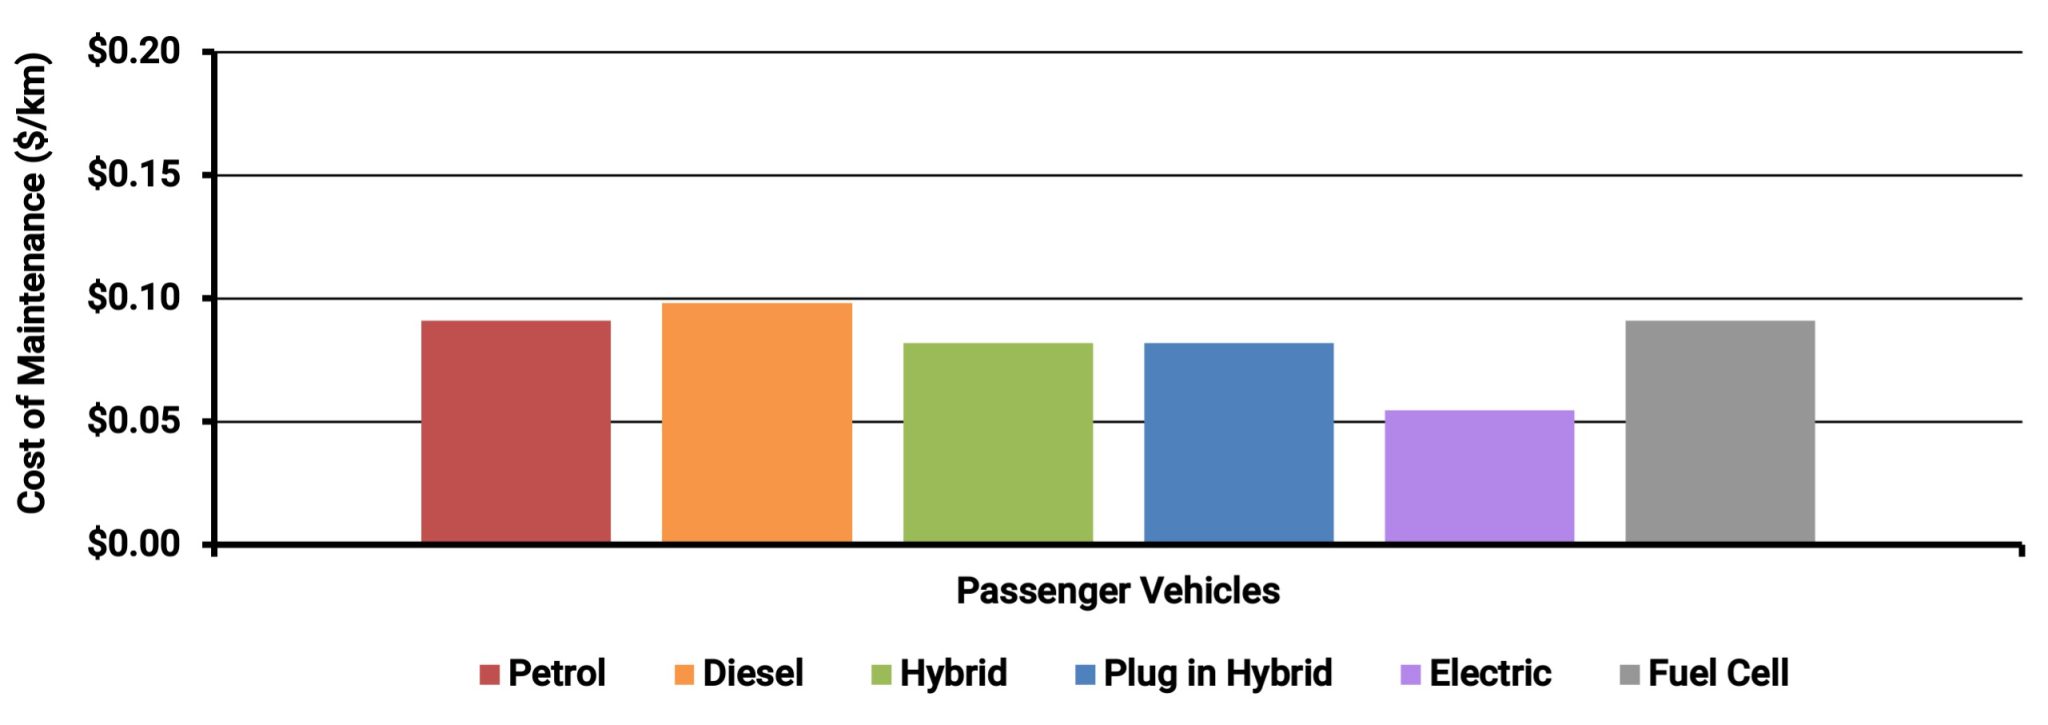
The figure below compares maintenance costs for passenger vehicles by propulsion and fuel type. Commercial vehicle costs are understood to be comparable. EVs are significantly lower cost, nearly half, that of the alternatives, however, maintenance costs are a small fraction of the total cost of ownership, and one that buyers of new vehicles see little of due to warranties.
Listen or click through at your own pace
The final element in the economics of BEVs is the refueling costs, which are estimated below by selected vehicle class, propulsion type and charging location. Off-peak home charging offers a 60%-70% discount compared to petrol, or diesel in the case of buses.
While most light duty vehicles are already at total cost of ownership parity, a key question is whether and when upfront cost parity will be achieved. This was a key threshold achieved by Norway, which saw a tipping point where BEVs became the most popular type of vehicle achieving over 90% of annual sales.[2]
Achieving Uptake Targets will Require Optimizing EV Policies and Practices
Government and industry are not able to influence all of the above factors directly, but there are a range of direct and indirect levers at their disposal that can exert a significant influence, including:
- Vehicle Bans / Minimum Energy Efficiency Regulations – Used to guarantee a target outcome, but can be unpopular; more countries appear headed in this direction
- Upfront Costs for Vehicles and Chargers – Rebates have been used by leading jurisdictions to accelerate adoption, but are increasingly being wound down due to cost as demand rises
- Refueling Costs – The structure and level of tariffs play a key role in refueling costs, and leading examples establish rates that remove cross-subsidies and reward flexibility
- Public Charging Infrastructure Availability – Grants have been the main lever used to date, however, research and modeling suggests that where charging is placed is critical
- Grid Availability – Electricity networks are developed to meet forecast demand, but not all utilities are forecasting impacts at the asset level, which may create bottlenecks to ramping up
Energeia research, analysis and modelling show that governments, regulators, utilities and EV industry players can each play a significant role in accelerating the transition to electric vehicles.[3]
The level of optimisation determines the market share of EVs.
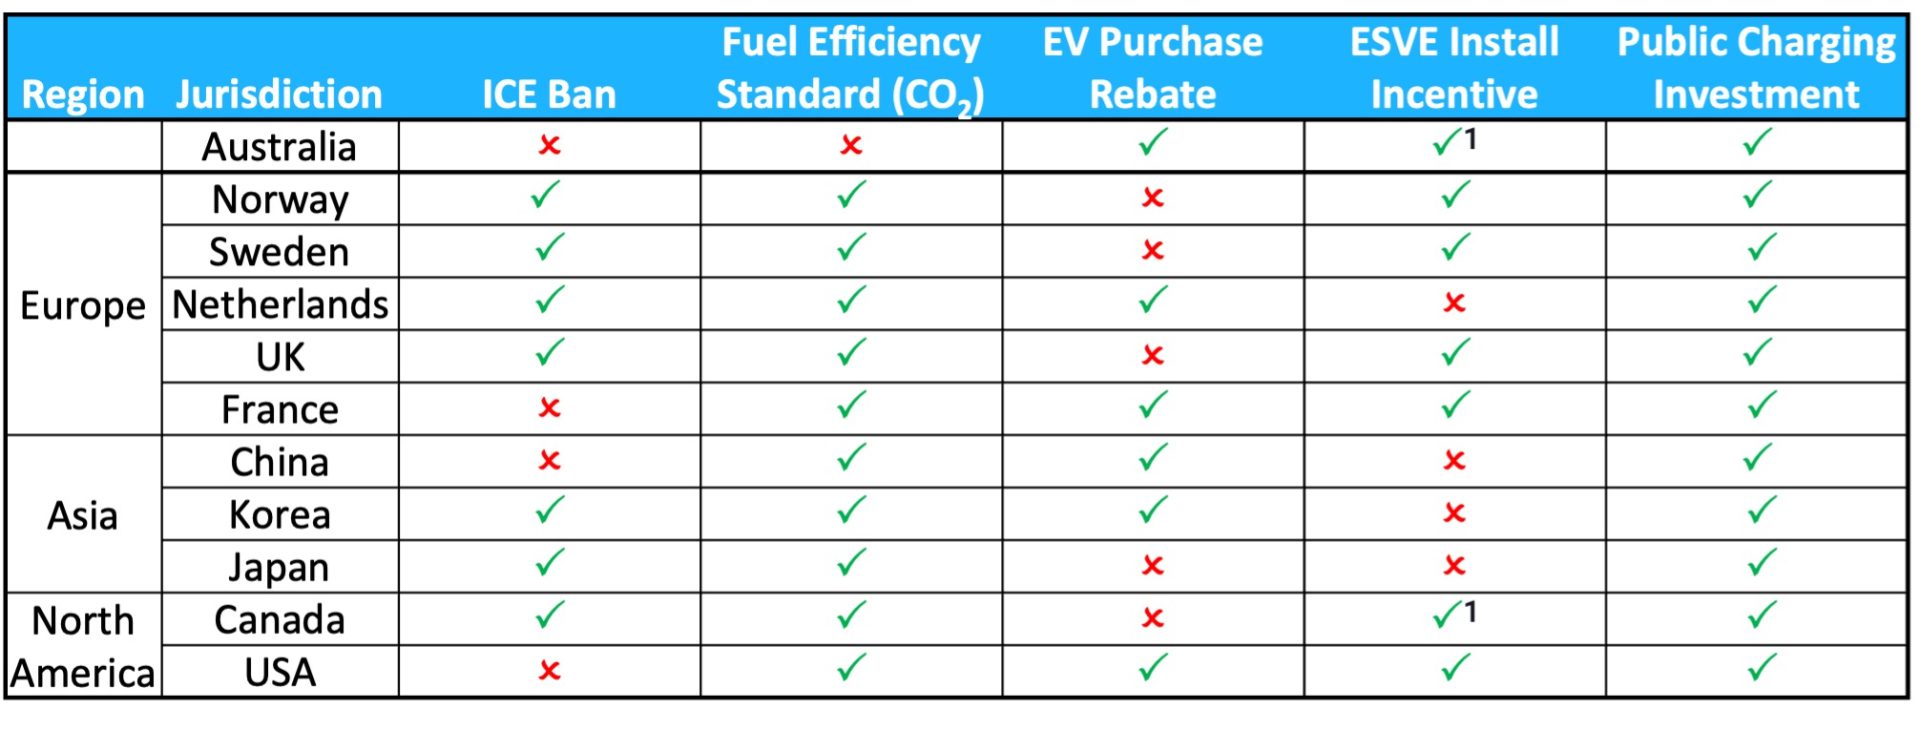
The figure below sets out a selection of key government policy parameters[4] by a selection of major jurisdictions. Australia’s settings at the moment are best practice in terms of purchase rebates (given stage of adoption), installation incentives and public charging investment – but not bans or standards.
The figure below shows the market share of BEVs as a percentage of annual vehicle sales. A key question is which of the above settings matters the most. Most countries with bans and energy efficiency standards remain relatively low in terms of BEV market shares, the exceptions are Norway and Sweden.
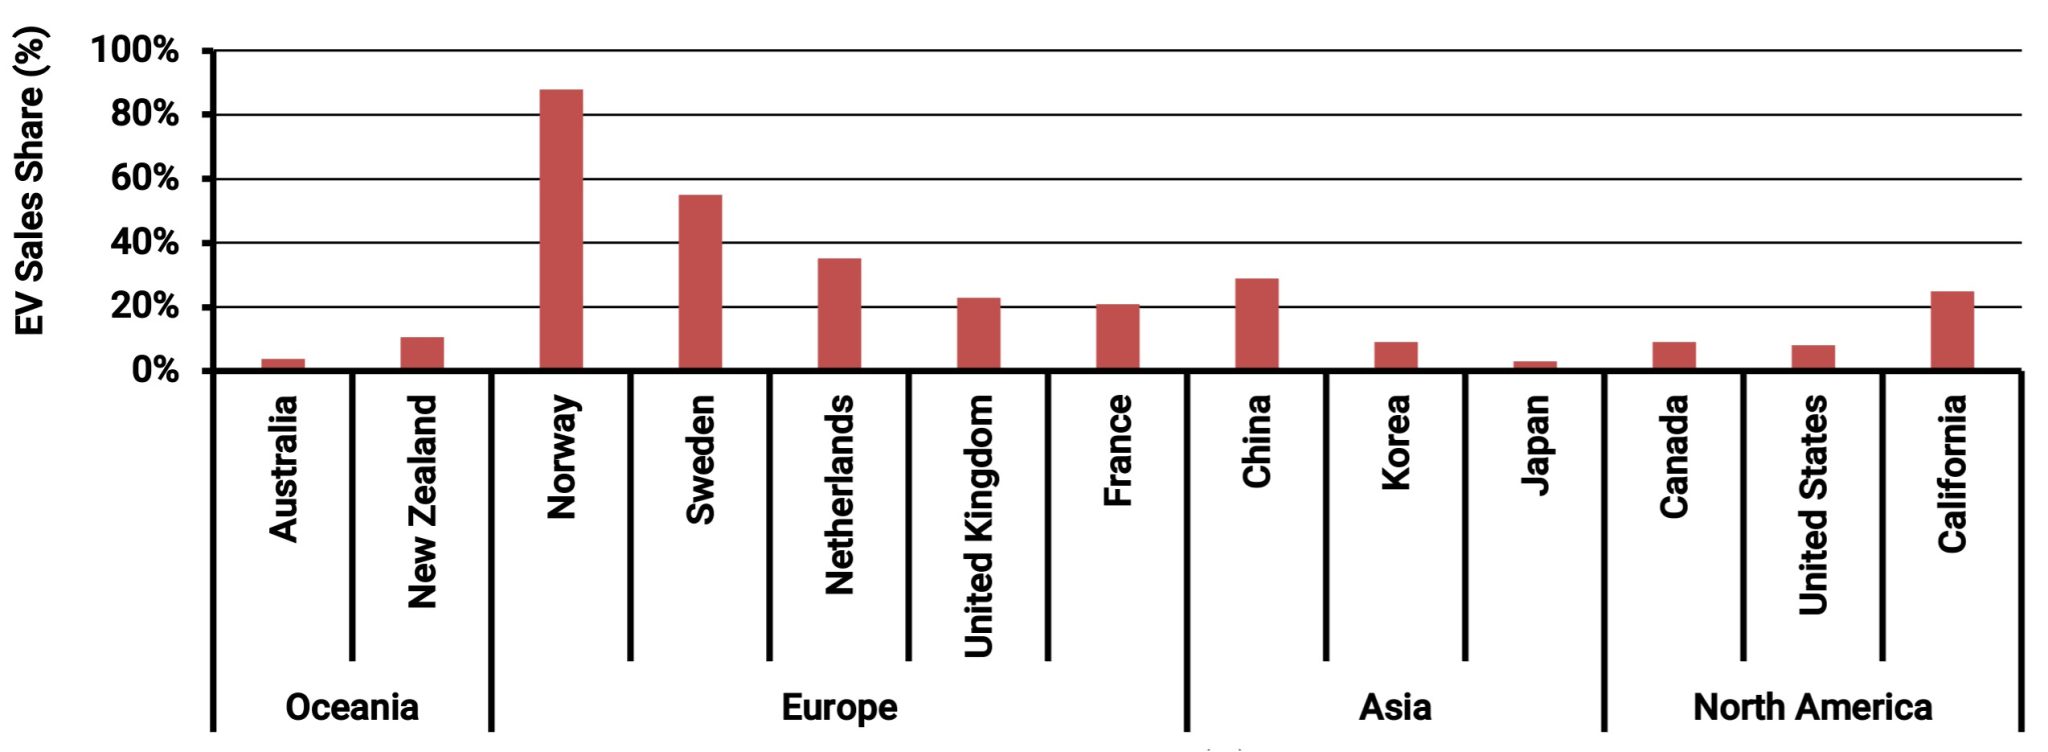
In Norway, electric vehicle incentives have meant that BEVs are lower cost to buy, and this is a key threshold most other jurisdictions have yet to meet. However, Energeia’s analysis has found that charging infrastructure and grid capacity are two other potential barriers that also need to be optimized to match Norway.
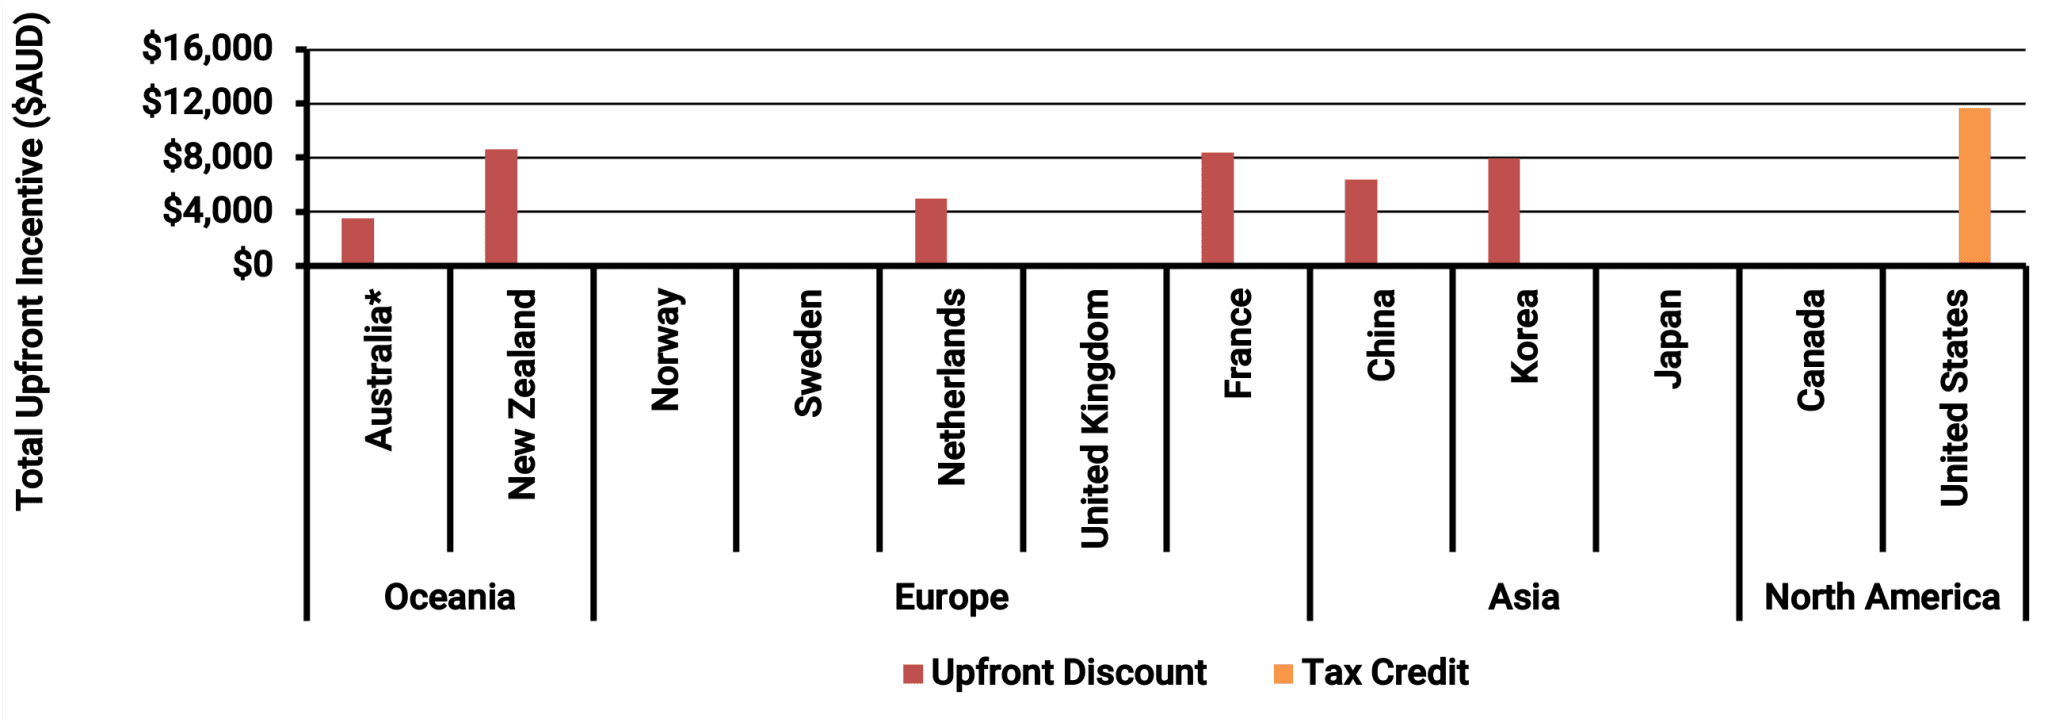
Australia will need a $10,000-$20,000 reduction in BEV prices and/or electric vehicle incentives to make BEVs cheaper than equivalent ICEs. The figure below shows that Australia is at the low end of electric vehicle incentives. They are also being unwound more than increased, and any energy efficiency standard is likely to replace them.
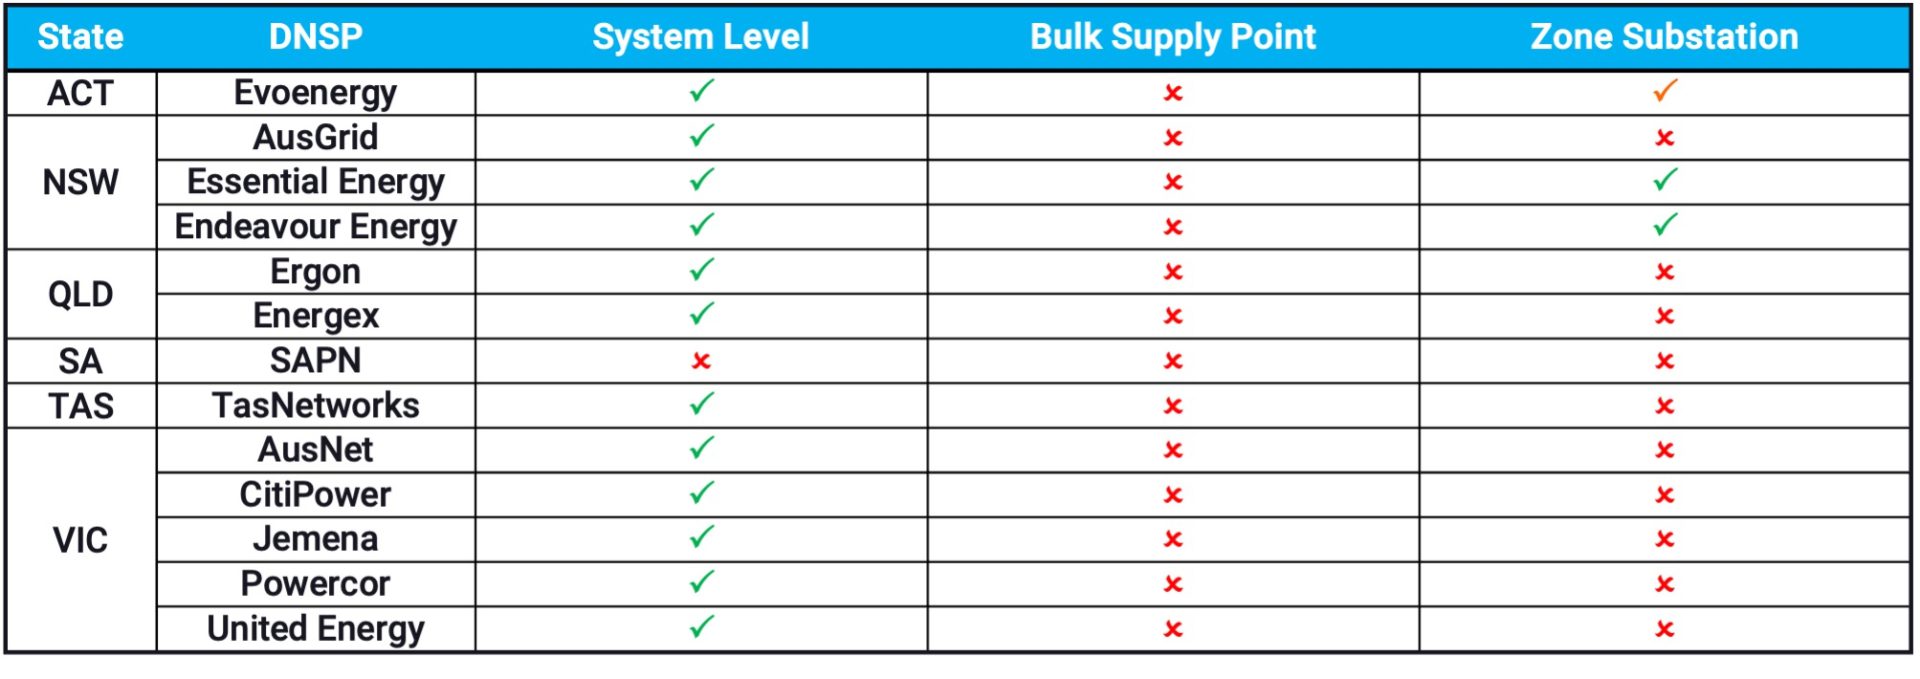
Although not nearly as powerful, utility rates can enable BEVs to achieve a total cost of ownership[5] parity with ICEs, which finance can them make more comparable. The table below shows that while many of the distribution utilities are ‘exploring’ BEV targeted rates, none have implemented them.
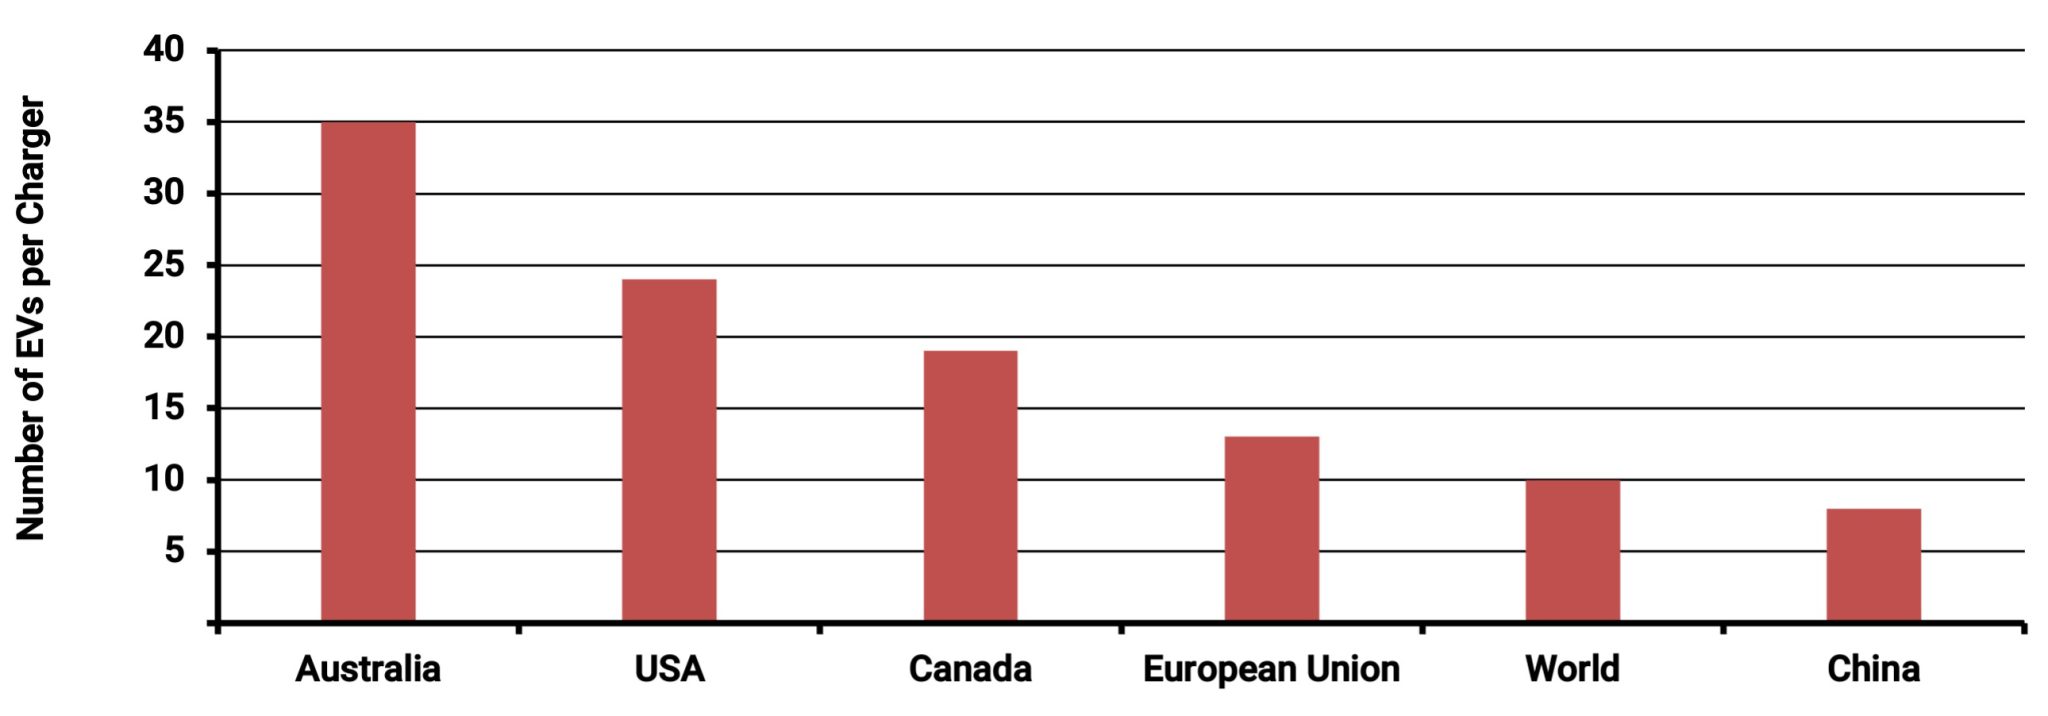
The figure below shows that Australia has deployed more public chargers on a per EV basis than any other included jurisdiction, followed by the US and Canada. However, based on the market share of BEVs, this is not a sufficient condition for increasing BEV adoption.
The final piece of the puzzle, and one that may not appear until BEV adoption begins to accelerate, is sufficient grid capacity to accommodate it. Due to the lead times involved, which can vary from 3-5 years for new HV feeders and longer for zone substations, it could stop adoption in its tracks.
The figure below shows the results of Energeia’s review of Australian distribution network utilities level of planning for BEV adoption, as measured by the level at which forecasts have been developed.
While the median zone substations in NSW, for example, have 10-15 MWs of capacity, it will not take that many fleet conversions[6] to eat up this capacity, depending upon when they charge.
Case Study Highlights a Least Cost Approach and the Importance of Infrastructure
Energeia has worked with a number of policymakers, transport organizations, utilities and public advocacy groups to optimise BEV related policies and practices. Based on that experience, we have developed a suite of tools to help us identify the incremental impact of various policies and practices, to inform optimisation.
The figure below shows the results of work completed in San Diego, CA, where we worked with policy makers to develop a suite of policies to hit their target uptake levels. Figure X shows the results of our modeling of a range of different utility rate and program options, as well as vehicle and charging rebate options, including for accelerated retirement of ICE vehicles. The modeling showed that deployment of public charging infrastructure in optimal locations would deliver between a 50:1 and a 10:1 great impact on uptake than rebates and other options – and mostly to disadvantaged groups.
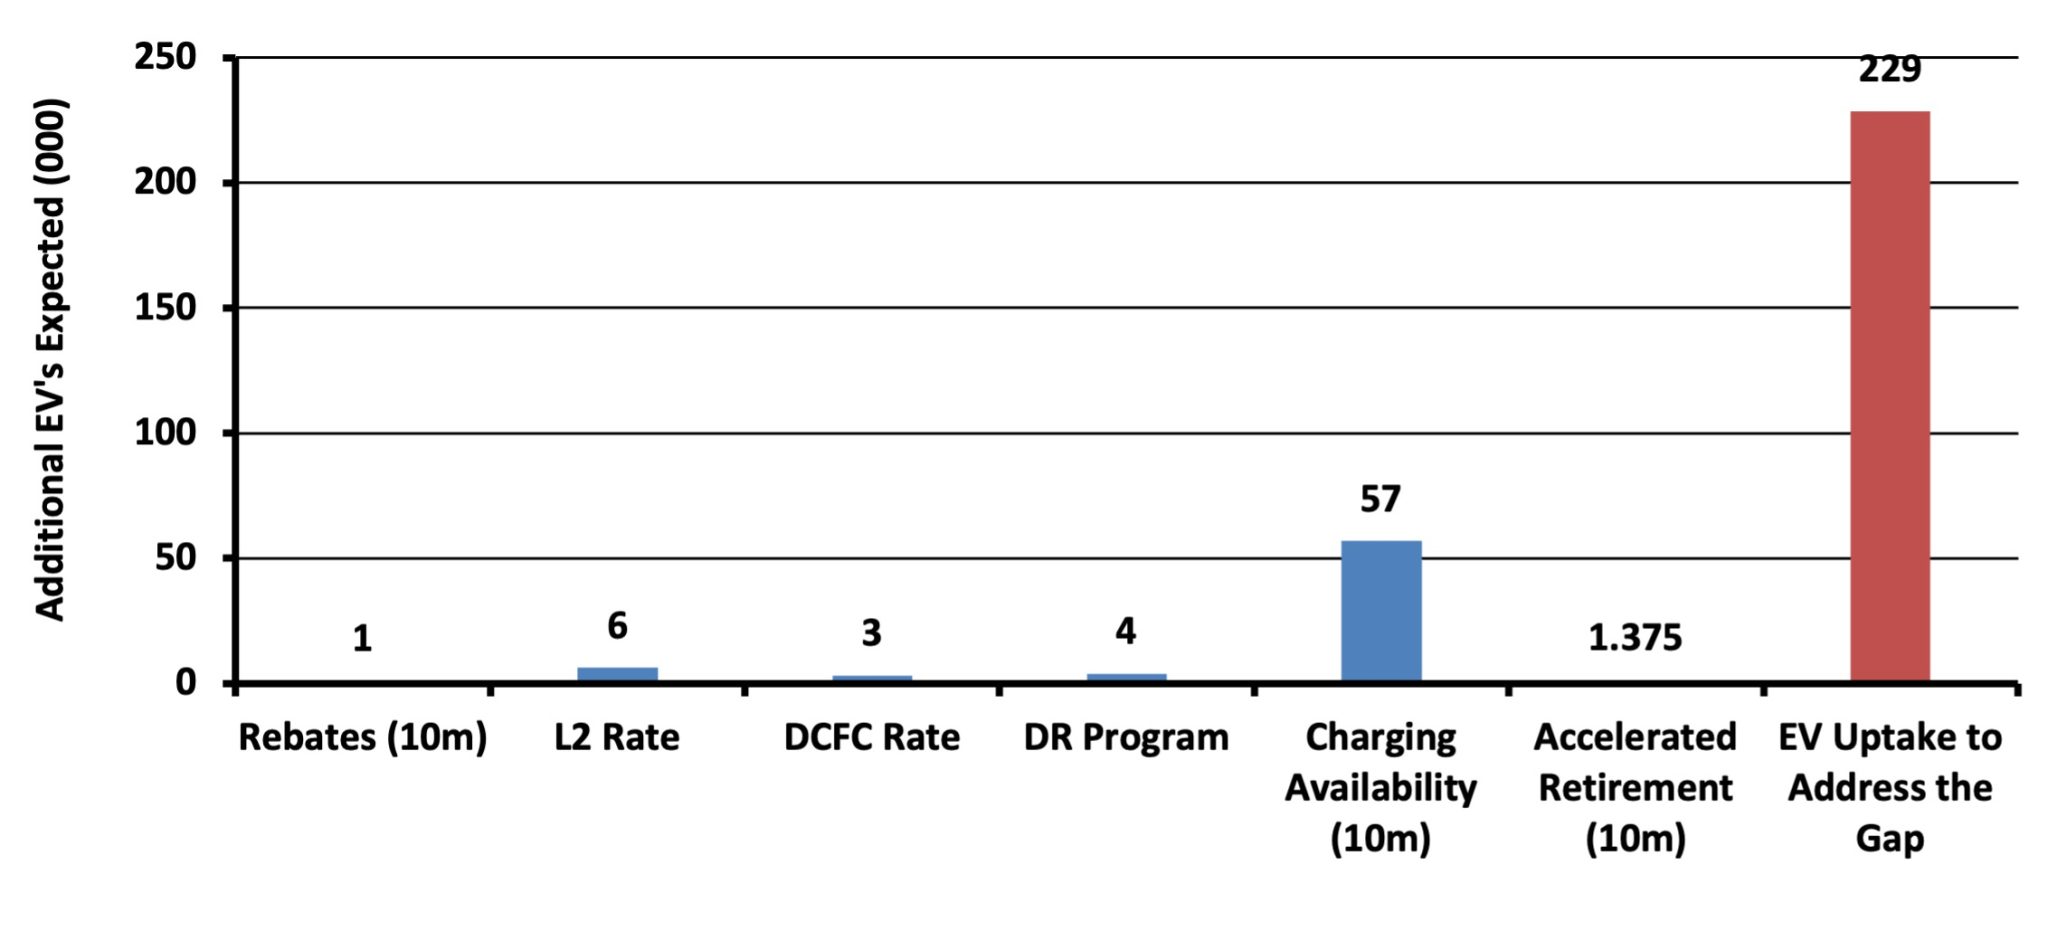
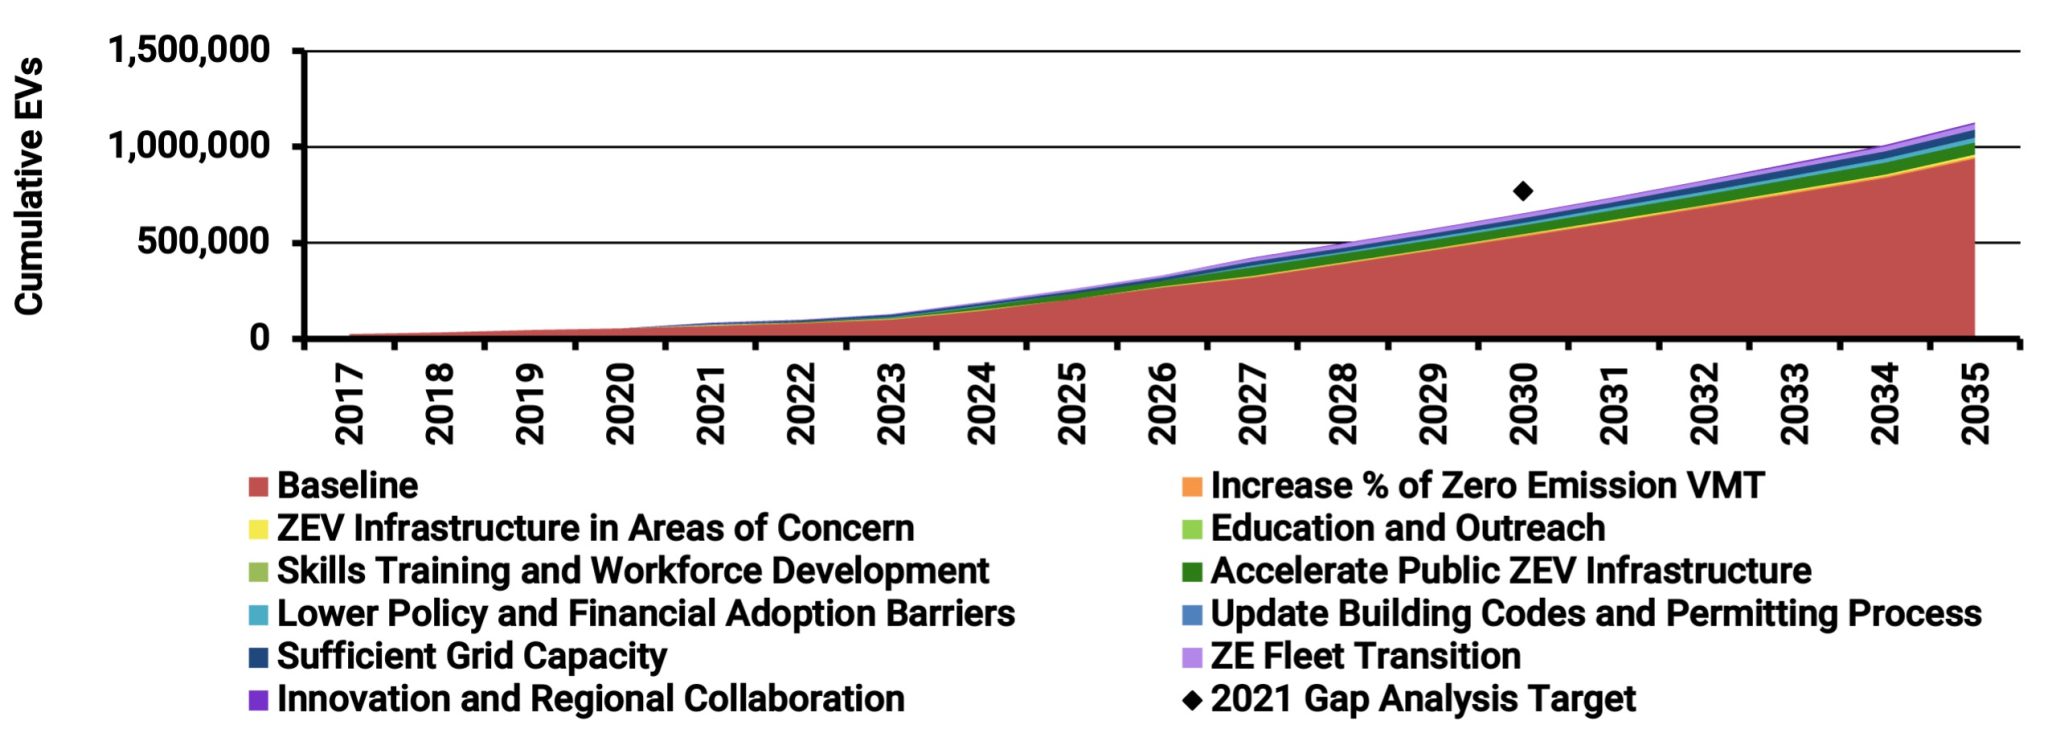
Using our tools related to vehicle uptake, Energeia was able to estimate the impact of each strategy on forecast uptake relative to the target, which is shown in the figure below. In this case, the combination.
Watch the full webinar playback below and follow along with the complete presentation.
For more detailed information regarding the key challenges of analysing and optimising EV incentives, best practice methods, and insight into their implementation and implications, please see Energeia’s webinar and associated materials.
For more information or to discuss your specific needs, please request a meeting with our team.
[1] Energeia acknowledges that the Commonwealth’s strategy is to mainly rely on LULUCF.
[2] Source: Inside EVs (2023)
[3] Not all vehicles will be purely electric, but his term is used throughout.
[4] Please see our webinar for a more comprehensive set of electric vehicle incentives and barriers.
[5] Owners can recover their higher upfront payment when they sell their vehicle.
[6] Energeia’s research has found that 50-100 vehicles is not uncommon, each potentially charging at 50-125 kWs.
You may also like

Natural Gas Decarbonisation Strategies and Impacts
Energeia’s research outlines key pathways, including renewable gas blending, thermal energy networks, and end-use electrification, all vital for achieving carbon targets while minimizing economic disruption.
The Balance of Ancillary Services Pricing
FCAS exist to provide AEMO with operational reserves in case of unplanned variations in demand and supply to keep demand and supply of electricity in

Energeia Assists AEMC on Potential Rule Change
The Australian Energy Market Commission (AEMC) has proposed draft rules aimed at transforming how power companies and consumers interact.
