Identifying a Least Cost CO2 Pathway

Be inspired to rethink CO2 emission analyses and its role in creating a more sustainable and prosperous future for everyone. Specifically, hear about cutting-edge methods for identifying least cost CO2 pathways that can be integrated into abatement targets and strategies

On 23 May 2023, Ezra Beeman, Managing Director of Energeia, Australia’s largest specialist energy consultancy presented the Power Sessions – Identifying Least Cost CO2 Pathways. Beeman discussed the current state of CO2 emission targeting and various methodologies for modelling industry and sector data. He also gave expert insights into best practices in determining least cost CO2 Pathways.

Best Practice CO2 Models for Net Zero Emissions Pathways

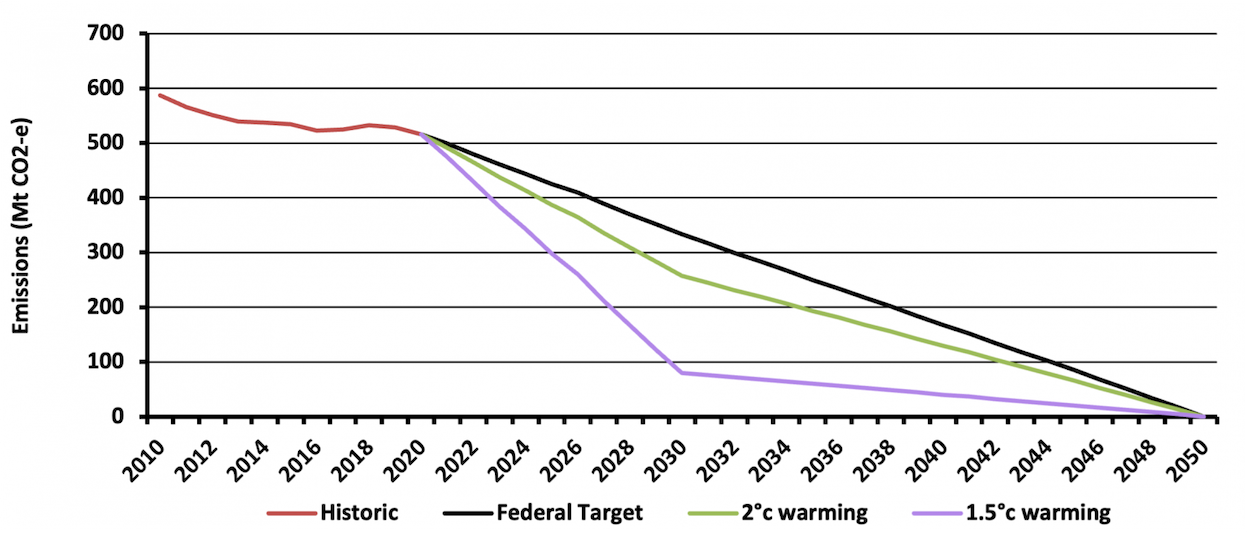
Australia has set CO2 reduction targets to comply with its Paris Accord obligations, resulting in net zero CO2 emission by 2045. The targeted trajectory to achieve this outcome is slightly less aggressive than that specified by the Intergovernmental Panel on Climate Change (IPCC) to avoid 2 degrees of warming. The Paris Accord requires signatories to increase their targets when it becomes cost-effective to do so.

Figure 1 – Australia’s 2C Emissions Budget Source: Climate College (2021)
Figure 1 – Australia's 2C Emissions Budget Source: Climate College (2021)
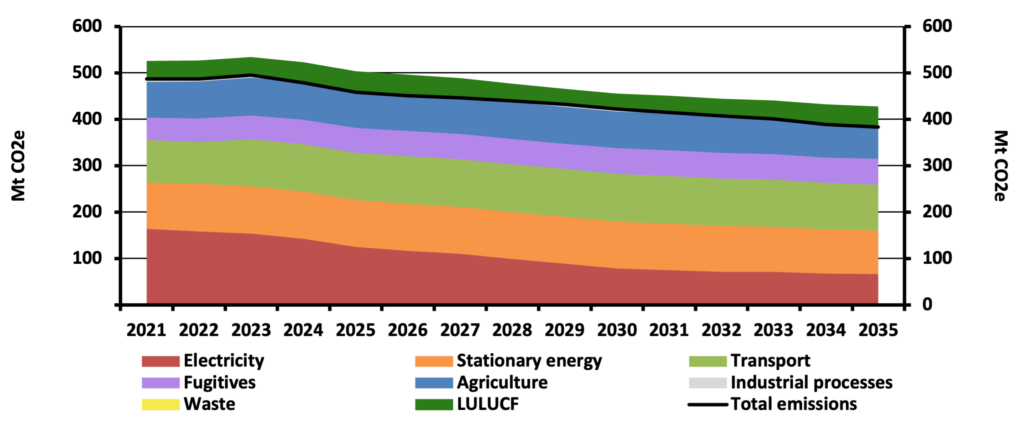
Figure 2 – Forecasted Emissions by Sector Source: AU Department of Climate Change, Energy, the Environment and Water (2022) Note: LULUFCF – Land Use, Land-Use Change and Forestry

Determining the most appropriate CO2 reduction pathway for utilities, CO2-intensive industries and policymakers requires balancing off the associated costs and benefits, which in turn requires significant, detailed knowledge about:

  • Industry sectors
  • End uses
  • CO2 reduction technologies
  • Supply costs
  • Customer behavior

Australia’s projected emissions by sector is shown below, along with the targeted emissions reduction.

This effort has been expanded by jurisdictions in setting their targets, but national target updates have been rare due to the level of effort involved. Australia’s most recent effort from 2022 to identify potential additional CO2 reductions are reflected in the figure below. Given the rate of change in CO2 reduction technologies worldwide, a significantly more aggressive trajectory is achievable.

Listen or click through at your own pace

CO2 Pathways Models

Due to the significance of global CO2 reductions, substantial effort and investment have gone into developing CO2 emissions models, often called CO2 ‘Pathways’ models. These insightful models are used to model the impacts, costs, and benefits of alternative CO2 pathways. Forecasting on a scenario basis allows the identification of the least cost pathways.

Energeia’s review of CO2 pathways modelling and development of least cost pathway implementations  found that best practices include the following:

  • Development of accurate estimates of measure costs over time as a key input
  • Coverage of all key sectors, segments, end uses, existing stock, and customer segment
  • Use of stock and turnover methods to identify emossions over time
  • User of a linear solver to identify a least cost pathway given cost and stock estimates
  • Customer behaviour modeling to identify uptake of meausres and the role of incentives
  • Reporting of measure voumnes, measure costs, and energy costs
  • Reporting of 8760 electricity, natural gas, and CO2 impacts
  • Reporting on a spatial basis, e.g., regional or more granular
An example of an illuminating CO2 pathway model output is a supply cost curve shown in Figure 4. In Energeia’s experience, while modeling CO2 pathways for a leading jurisdiction in the US, developing a CO2 emissions supply cost curve by year and over time was the key to identifying an optimal pathway. The CO2 pathway model was essential in identifying the prioritization of emissions in their pathway to achieving a given target at the least cost.

Figure 4 – Supply Cost Curve (Natural Gas and Oil GHG Only) Source: Our People Council (2021)

A supply cost curve can also feed back into target setting by identifying changes in cost over time and the additional level of abatement that can be delivered for the same cost, as the Paris Accord requires. Another key use is to identify measures expected to deliver the greatest benefit or the end use that is the highest cost to decarbonise, both of which can be used to target and optimise research and development investment.

A final step in the CO2 pathways modelling and optimization process, where most of the reduction efforts are moved on to the electricity system, is identifying the least cost mix of resources needed to deliver the target CO2 levels over time. The figure below shows the results of a recent CO2 pathways and optimisation modeling project, which found that onshore wind and fuel cells were the keys to achieving a net zero carbon and, eventually, a 24/7 electricity system by 2035.

Figure 5 – Resource Portfolio Costs by Year Source: Our People Council (2021)  

For more detailed information regarding the key challenges of analysing and optimising CO2 pathways, best practice methods, and insight into their implementation and implications, please see Energeia’s webinar and associated materials.

For more information or to discuss your specific needs, please request a meeting with our team.

[1] A number of plans refer to themselves as integrated, but do not endogenously model consumer behavior.

You may also like

Scroll to Top