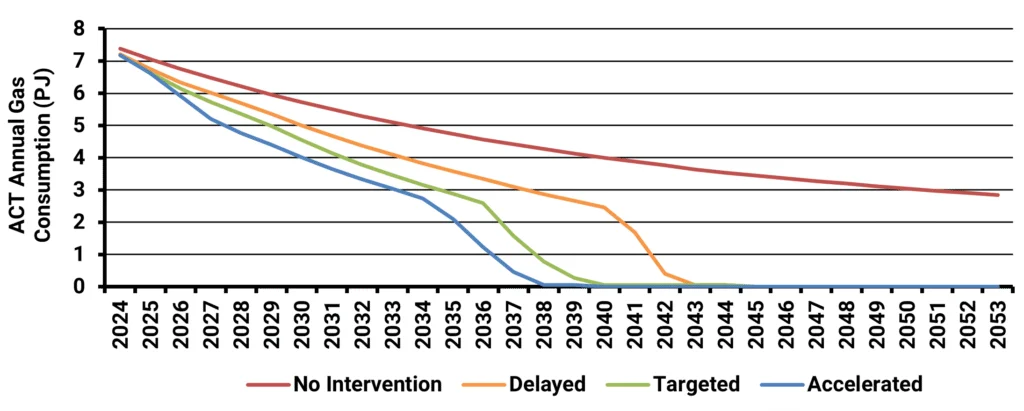
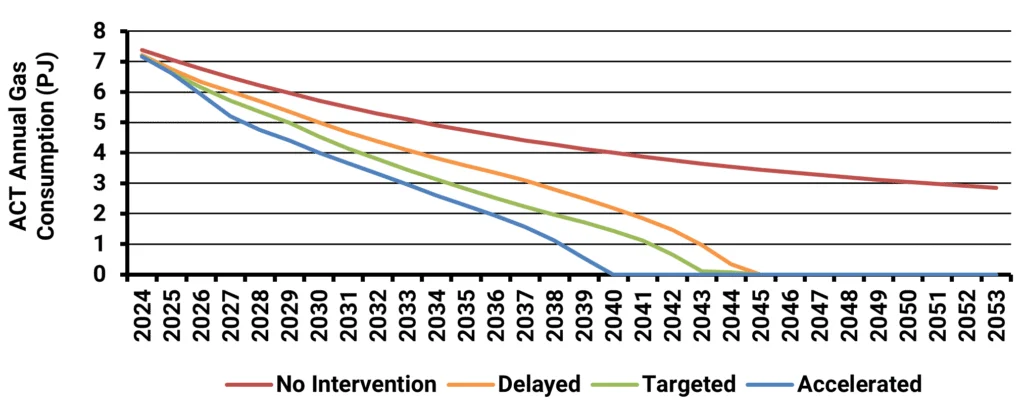
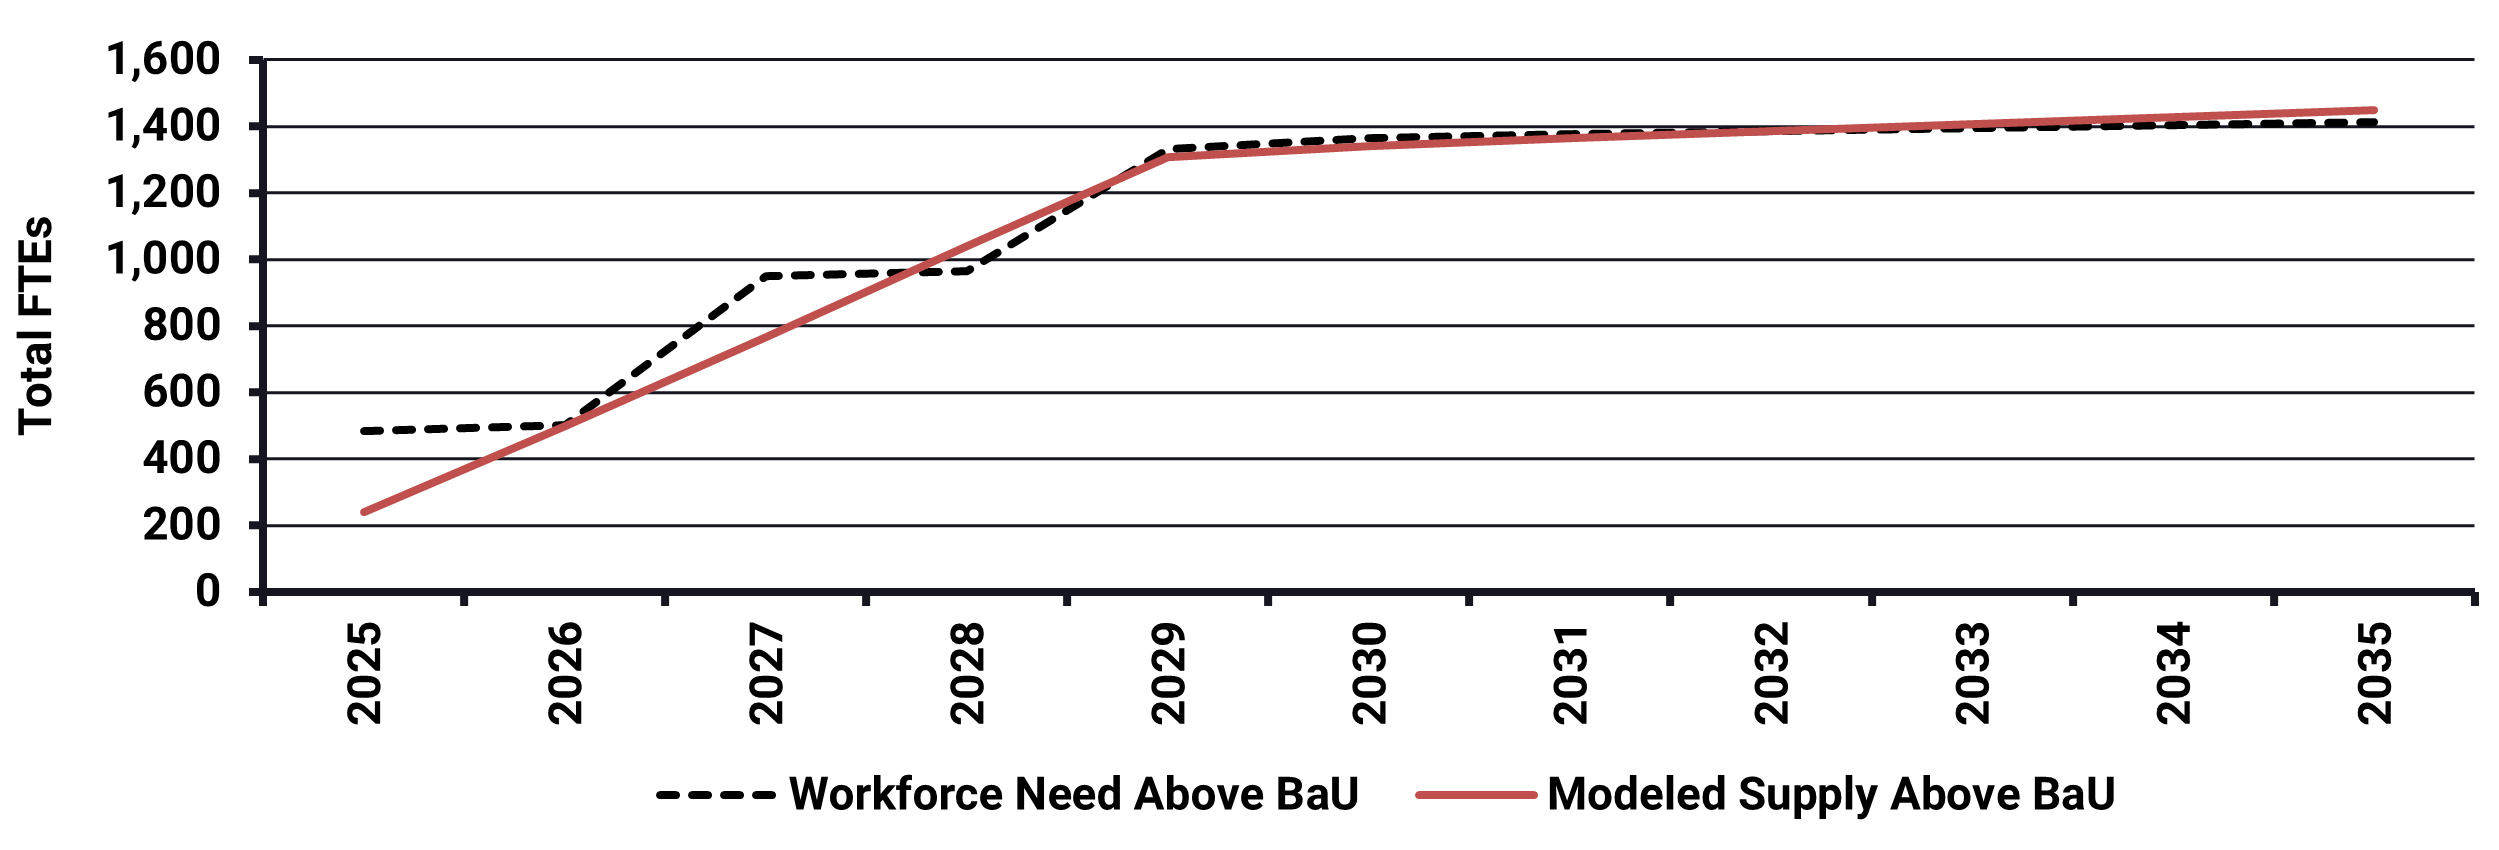
Bridging the Skills Gap: Workforces for Electrification

Australia’s clean energy transition demands a skilled workforce. Energeia’s analysis reveals urgent needs, strategic solutions, and policy pathways to bridge the electrification skills gap and meet 2050 net-zero goals.

The Paris Agreement targets limiting global warming below 2°C, with an additional goal to keep global temperatures below 1.5°C, from pre-industrial levels. Current AU targets include a 43% reduction in 2005-level (baseline) emissions by 2030 and a net-zero goal for 2050. The Department of Climate Change, Energy, the Environment and Water (DCCEEW) has modelled AU emissions projections as achieving both their GHG emissions reduction target and emissions budget target by 2030, shown in Figure 1 below.

Figure 1 – AU Historic and Target CO2e Emissions, Source: DCCEEW (2024), Note: Target trajectories are shown from the year the target was set to the target year

Figure 2 below shows state and federal CO2 targets to 2050, with the ACT and Victoria committing to some of the most comprehensive climate targets, driven by state policy. Understanding the opportunities and challenges related to decarbonisation is key to ensuring that the associated policy settings are effective, and workforce development is increasingly at the top of this list.

Figure 2 – State and Federal CO2 Targets, Source: Energeia, DCCEEW (2024), State Governments, Note: Energeia legend includes “State”, 2020 datapoint is historical, TAS has already exceeded net zero target and are net negative

Energeia’s approach to determining workforce needs and development solutions is broken down into a workforce impact assessment, which assesses the change in workforce requirements over time due to multi-sector decarbonisation, and workforce solution development, which identifies and optimises the solutions available to meet the forecast workforce needs.

Workforce Impact Assessment

The following sections provide examples of workforce requirements analysis we have completed in key decarbonization topics, and highlights the associated key methods, issues and insights:

  • Building electrification
  • Gas sector decarbonisation
  • Future electricity utilities
  • Gas infrastructure decommissioning
  • Renewable energy transition

Building Electrification

The following charts show Energeia’s analysis of the number of Full-time Equivalent (FTE) personnel required under different policy options related to electrifying appliances. One of the Australian state governments was considering policy options to achieve faster gas system decarbonisation.

The analysis considered the impact of banning gas connections in new premises, and/or banning the sale of new gas appliances for existing appliances at their end of life. The modelling showed that bans would have significant impacts on trade jobs, with Figure 3 showing the business-as-usual outcome, and Figures 4 and 5 showing the policy options gas connection ban and gas appliance ban, respectively.

Figure 3 – Business as Usual, Source: Energeia Modelling
Figure 4 – No Gas in New Premises from 2023, Source: Energeia Modelling
Figure 5 – No New Gas Appliances Sold from 2024, Source: Energeia Modelling

The results of the scenario analysis above show that each policy option results in a large increase in electric-related work hours and a decrease in gas-related work hours. Both the gas connection ban and appliance ban scenarios result in changes to workforce needs.

A key recommendation was to set bans far enough in the future to allow the market to adjust as well as stagger bans. For example, start with residential water heaters, followed by space heaters, then commercial water heaters, then space heaters, and so on.

Gas Sector Decarbonisation

The following charts show Energeia’s analysis of the number of FTEs required for different gas system decarbonisation pathway options. This US state was considering a wide range of options to decarbonise its gas sector, and not just electrification.

Energeia modelled the impact of each pathway on sector utility and trade jobs. The impacts were mainly estimated using throughput and installation labour estimates. The analysis highlights the significant differences in potential impact depending on the pathway chosen.

Figure 6 – Forecast Change in Gas Trade Jobs, Source: Energeia analysis, Note: BaU = Business as Usual, CF = Cleaner Fuels, SDF = Statewide Dual Fuel, LCF/EE = Low Carbon Fuel/Energy Efficiency, CZA = Climate Zone Approaches, HEF = High Electrification Future, TU = Thermal Utility
Figure 7 – Forecast Change in Electric Trade Jobs, Source: Energeia analysis, Note: BaU = Business as Usual, CF = Cleaner Fuels, SDF = Statewide Dual Fuel, LCF/EE = Low Carbon Fuel/Energy Efficiency, CZA = Climate Zone Approaches, HEF = High Electrification Future, TU = Thermal Utility

The above analysis highlights the high level of variation of skilled labour requirements across different sectors due to policy decisions, and the importance of considering potential workforce shortages on policy implementation.

Future Electricity Utilities

Electricity utilities are also impacted by the increasing decarbonisation of consumer end uses and the grid. The following analysis was developed through an engagement with a US utility that is aiming for 100% renewable energy in the next 10 years, where Energeia developed workforce estimates from strategic plans, human resources, and finance datasets. The project identified the workforce needs vs. supply gap based on current recruitment and training capacity, and developed a strategy for addressing them.

Future FTEs by class were estimated over time, based on planned investments in the distribution, transmission, generation, and BTM program capacity and capabilities. Figure 8 below demonstrates the change in the number of employees needed for the utility.

Figure 8 – Forecast Change in FTEs Needed Over Time, Source: Energeia analysis, Note: Field = Field Services, EE/BE/PV = Energy efficiency, building electrification and photovoltaics, Eng = Engineering, Major = Major Works, Dx = Distribution, Gx = Generation

Moving to a 100% renewable grid is likely to involve a more decentralised system, requiring a large shift in focus and reallocation of spending and workforce composition. Key recommendations from this work include the need to enhance their understanding of:​

  • Future changes in job and skills mix​
  • Integration of relevant data systems, including HR, finance, and system planning
  • Strategies to increase capacity and capability​
  • Strategies for optimising make vs. buy decision

Gas Infrastructure Decommissioning

The government of the Australian Capital Territory (ACT) was considering methods of shutting down the gas network over time, as well as different policy options that would assist in transitioning people off gas. Figures 9 and 10 below show two different methods for shutting down the gas network. The first is to shut down portions of the gas network once consumption has fallen below a certain threshold and the second is to shut down an equal portion each year.

The modelling outcomes below show that different decommissioning strategies would have very different impacts on demand for gas and electricity.


Figure 9 .– Gas Consumption Over Time Using a Threshold-Based Decommissioning Approach, Source: Energeia
Figure 10 – Gas Consumption Over Time Using a Phased Decommissioning Approach, Source: Energeia

Listen or click through at your own pace

The two methods, which are achieving similar outcomes, have very different gas and electric sector impacts. The difference in these two graphics shows the importance of considering the impacts of policies on skilled labour requirements.

Key recommendations from the work included banning new appliances as soon as possible to avoid future asset stranding costs, pushing out decommissioning as far as possible to minimise stranding of existing assets, and managing price increases to avoid uneconomic switching over time​.

Workforce impact analysis was not in scope, but the difference in network shutdowns by scenario show the potential for rapid change in utility and trade jobs between the gas and electric systems​.

Energeia’s detailed report can be found here.

Renewable Energy Transition Jobs

Energeia has identified an ARENA-funded study that aimed to identify the FTEs needed to transition the country’s industrial energy demand to 100% renewable energy. It follows a similar approach to our previous examples, and is largely focused on utility-scale renewables, hydrogen and batteries, and the transmission grid (not appliances or distribution). The study found the country will need almost 10 times more employees by 2050, as shown in Figure 11.

Figure 11 – Projected Number of Jobs by Type, Source: Accenture (2023): Skilling Australian Industry for the Energy Transition

In terms of the break-out by industry sub-sector, shown in Figure 12 below, the study found that most FTEs would be needed in solar, wind and hydrogen. Interestingly, transmission and storage were found to need less than half the amount of FTEs as the other sub-sectors.

Figure 12 – Projected Number of Jobs by Renewable Sector, Source: Accenture (2023): Skilling Australian Industry for the Energy Transition

Analysis completed for the study identified, within specific career types, differences in demand by carbon and renewable economies, shown in Figure 13 below. Demand for electricians is expected to rise sharply, while demand for drillers, miners and shot firers is expected to fall precipitously.

Figure 13 – Difference in Occupational Demand by Scenario, Source: Accenture (2023): Skilling Australian Industry for the Energy Transition, Note: Eng = Engineers

Petrochemical and chemical production have very high abatement costs, as shown in Figure 8 below, with carbon capture the lowest cost solution to full abatement, and hydrogen alternatives the highest cost solution of any hard-to-abate solutions considered.

Figure 8 – Petrochemical and Chemical Production Costs by Abatement Solution, Source: IEA (2021 & 2023). Note * indicates a solution that can address all stages of production

The study also summarised the difference in short-term status and long-term job requirements by occupation. The findings show that almost all of the top occupations are in shortage.

Table 1 – 2030 Jobs Supply Requirement vs. 2022 Shortage Status, Source: Accenture (2023): Skilling Australian Industry for the Energy Transition

If these shortages are not addressed, then the planned transition will not be possible.

Workforce Solution Development

The following section outlines the key workforce dynamics, including current trends, challenges and solutions for meeting the required increase in the workforce.

Workforce Dynamics

The majority of institutes that provide Vocational Education and Training (VET) services are run by Private Training Providers, followed by schools, and Community Education Providers, as shown in X.

Private training providers also have the most students enrolled, with the number of enrolments rising every year. Technical and Further Education (TAFE) Institutes and Community Education Providers also enrol a significant number of students every year.


Figure 14 – Number of VET Providers by Type, Source: National Centre for Vocational Education Research (2023)

The majority of trades require a minimum of a Certificate III in order to become a licensed tradesperson, and as such, it has the highest completion of all the certificates. However, enrolment and completion of VET courses have been steadily declining over the last several years

As these emerging industries compete for fewer graduates, wages are likely to increase, increasing the cost of the transition.

Key Barriers

Energeia has summarised the key workforce barriers below, which were determined from both contractor interviews and research. Interviewees cited barriers such as the competitiveness of wages, blue-collar job stigma, retraining incentive availability and uncertainty around demand for green jobs.

Table 2 below summarises the identified barriers which included a decline in energy job interest, a small pool of workers, a lack of training access, and high entry requirements.

Table 2 - Key Workforce Barriers, Source: Energeia Research

Career Attractiveness

Energeia analysed hourly wages for blue-collar jobs and compared them to the hourly wages of the contractors who install building electrification appliances. The findings showed that plumbers, electricians, and heating, ventilation, and air-conditioning (HVAC) professionals all make significantly more than most non-building electrification (BE) blue-collar jobs in this example.

  • Electricians make ~$51/hr on average
  • HVAC professionals make ~$50/hr on average
  • Plumbers make ~$45/hr on average

Figure 15 – Contractor Wages Compared to Blue Collar Trades, Source: Energeia Research

The key takeaway here is that plumbers, electricians, and HVAC professionals have competitive salaries when compared to other trade jobs. However, to attract more of the workforce, they will have to be even more attractive.

Workforce Development

The following table summarises the challenges and associated strategies to overcome these challenges in the electrification workforce, along with best practice workforce development strategies from the US.


Table 3 - Strategies to Increase Building Electrification Workforce (US), Source: Energeia Research

On the basis of the above challenges and solutions, Energeia develops a targeted workforce strategy that addresses key workforce needs and barriers. Table 3 below captures the estimated costs, and workforce impacts of selected key solutions from one of our recent engagements in California.

  • Entry-level bonus reflects the average signing incentives provided to new entrants upon completing training in trades such as HVAC, electrical, and plumbing, based primarily on actual California industry data.
  • those who completed a training course.

Energeia also developed an estimate of the cost of process improvements and advertising campaigns based on experience, but these numbers should be validated on a case by case basis.


Table 4 – Workforce Development Strategies, Costs and Impacts, , Source: Energeia Analysis. Percentage impacts represent estimated values

The resulting, illustrative workforce development program impacts are shown Figure 16. They include strategies for increasing the efficiency of the existing workforce, e.g., instant permits and streamlining. In this case, the plan was smoothed to reflect the realities of hiring and program implementation (ideally, it should ramp up). The resulting, illustrative workforce transition is shown below against the target needed to hit the identified building electrification goals.

Figure 16 – Workforce Need Above BaU vs Modelled Supply, Source: Energeia Analysis

Takeaways and Recommendations

Energeia’s key takeaways and recommendations for tackling the skills gap in the workforce implementing decarbonisation are summarised below.

Key Takeaways:

  • Achieving federal, state and city decarbonisation targets will require significant workforce development
  • The impacts across the electric, natural gas, refined product, and utility sectors vary significantly by pathway
  • Best practice government and utility policy planning includes assessment of impacts, and workforce development strategies and plans
  • Workforce planning can effectively manage the transition in a timely and equitable basis
  • Workforce development infrastructure will need to grow and change to meet expected workforce development needs
  • Workforce development funding will need to grow to meet growing transition targets and is a key gap at the moment

Key Recommendations:

  • Ensure that transition policy planning includes workforce impact and optimisation assessments, development strategies, plans and funding
  • Engage with the workforce early to identify and address local issues and potential strategies, or risk significant pushback
  • Understand the timing and mix of workforce impacts, and develop strategies to ensure an equitable, timely transition
  • Significant education and support likely to be needed across a wide range of sectors, ensure programs and funding are commensurate

For more detailed information regarding the key challenges of analysing and optimising electrification, best practice methods, and insight into their implementation and implications, please see Energeia’s webinar and associated materials.

For more information or to discuss your specific needs, please request a meeting with our team.

You may also like

Scroll to Top